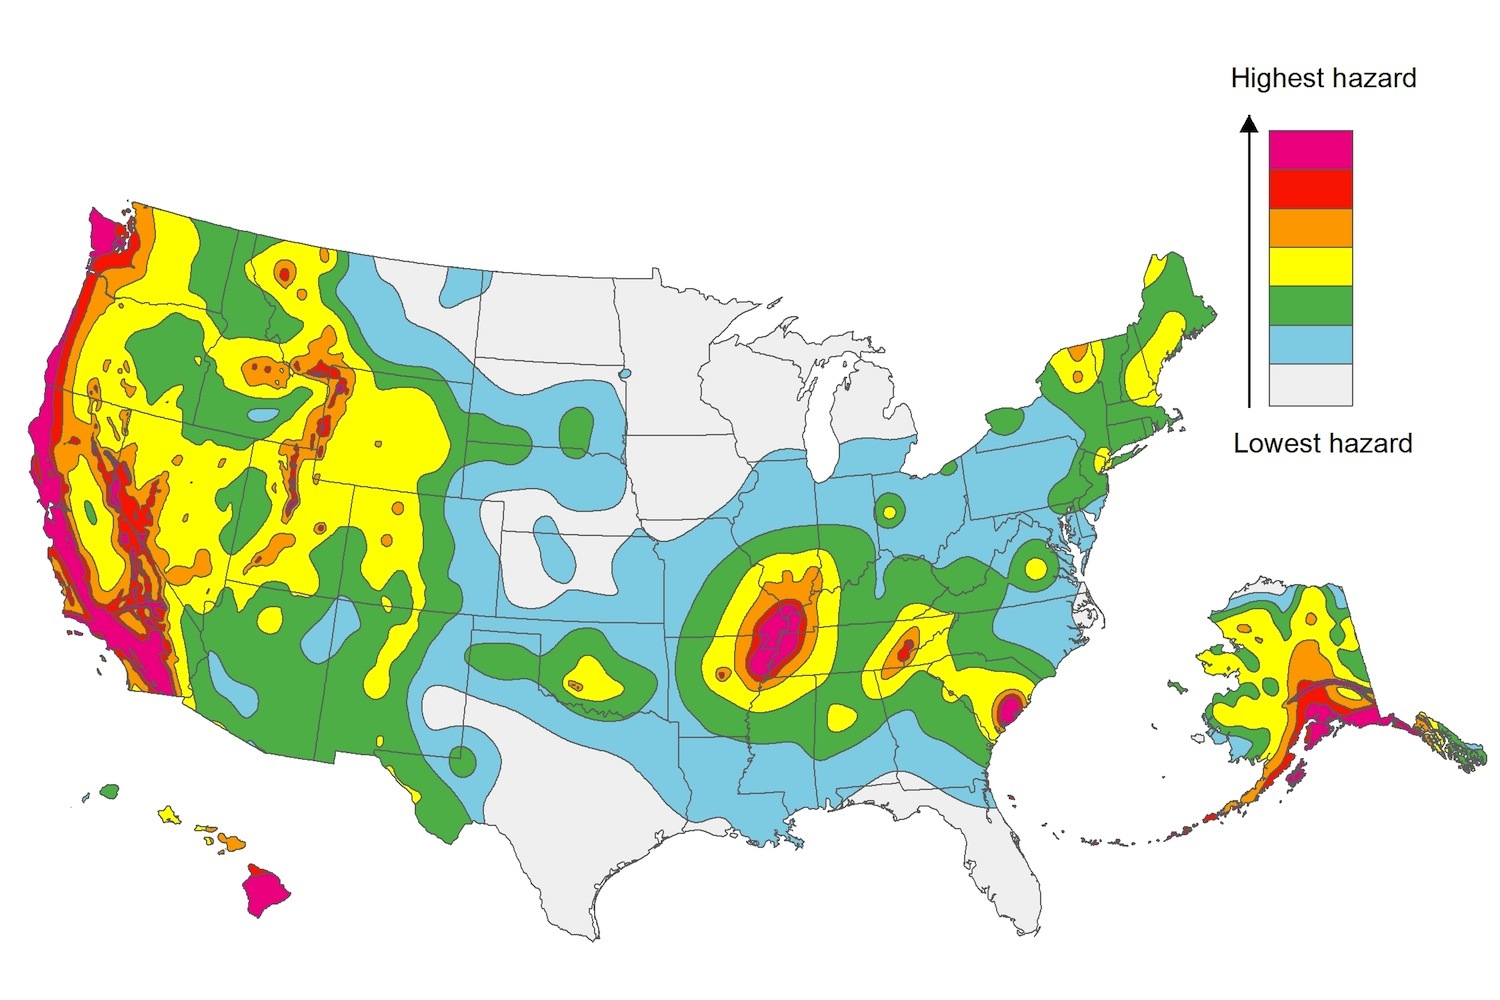
The U.S. Geological Service recently released an update of U.S. National Seismic Hazard Maps that reflect the latest analysis of where future earthquakes will occur, how frequently they may occur, and their strength.
While all states have some potential for earthquakes, 42 of the 50 states have a reasonable chance of experiencing damaging ground shaking from an earthquake in the next 50 years. Sixteen states have a relatively high likelihood of experiencing damaging ground shaking. These states have historically experienced earthquakes with a magnitude 6 or greater. The hazard is especially high along the west coast, intermountain west, and in several active regions elsewhere such as near New Madrid, Mo., and near Charleston, S.C.
The eastern U.S. has the potential for larger and more damaging earthquakes than considered in previous maps and assessments. This finding is due to what scientists learned following the magnitude 5.8 earthquakes that struck Virginia in 2011. It was among the largest earthquakes to occur along the east coast in the last century, and indicated that even larger events in the region are possible.
The maps are used in risk analyses calculated using factors such as population levels, building exposure, and building construction practices. These assessments are used for establishing building codes, in the analysis of seismic risk for key structures, and in determining insurance rates. They can also aid emergency preparedness plans, and private property decisions such as re-evaluating one’s real estate and making it more resilient.
(http://www.usgs.gov/blogs/features/usgs_top_story/new-insight-on-the-nations-earthquake-hazards/)
Related Stories
Green | Jan 29, 2016
USGBC names top 10 states for LEED green building
Illinois leads the list for the third straight year.
Codes and Standards | Jan 25, 2016
Dept. of Energy releases decision guides for plug and process loads
Plug and process loads consume about 30% of the primary energy in U.S. commercial buildings today.
Codes and Standards | Jan 22, 2016
ConsensusDocs releases new multi-party IPD agreement and joining agreement
The documents serve as a comprehensive revision of previous IPD agreement
Codes and Standards | Jan 22, 2016
State Savings Calculator analyzes savings associated with energy codes
The calculator breaks down the cost-effectiveness of energy codes on a state-by-state basis.
Codes and Standards | Jan 22, 2016
Metal Roofing Seaming Guide published by Metal Construction Association
The free document is specifically tailored for metal roof installation.
Codes and Standards | Jan 22, 2016
Treasury Dept. will start crackdown on illicit money in luxury real estate
The move is expected to impact high-end condo development.
Resiliency | Jan 13, 2016
LEED credits on resiliency expected to influence future of building design
Post-disaster survivability is a key goal.
Codes and Standards | Jan 12, 2016
Batteries are the next step in raising sustainability standards
Battery technology will reduce electricity costs and promote a more stable, flexible grid.
Codes and Standards | Jan 4, 2016
Denver broadens its use of design reviews as construction booms
Support strong, but some wary of giving more say to review boards.
Codes and Standards | Dec 23, 2015
International Code Council approves updates based on NIST study of Joplin, Mo. tornado
Applies to schools and other high occupancy buildings.


