


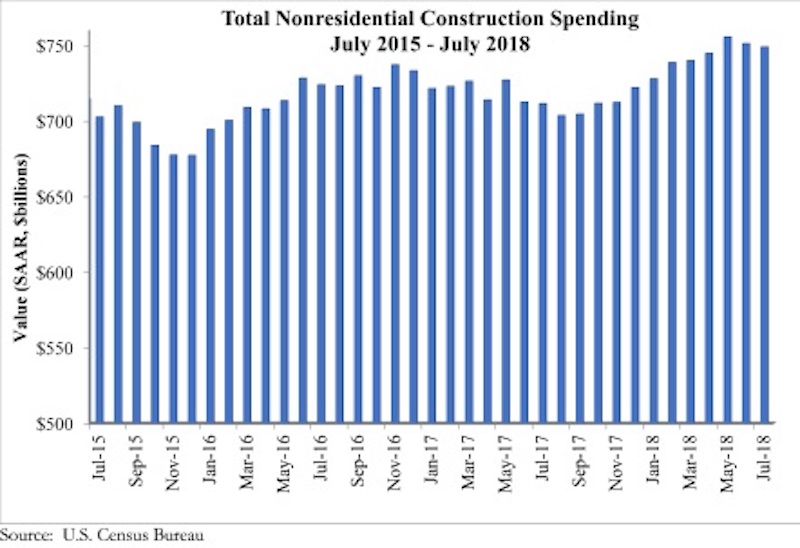
National nonresidential construction spending declined 0.3% in July, according to an Associated Builders and Contractors analysis of U.S. Census Bureau data recently released. Total nonresidential spending stood at $748.8 billion on a seasonally adjusted, annualized rate in July, an increase of 5.3% from the same time last year. Private nonresidential spending fell 1% in July, while public nonresidential spending expanded 0.7%.
“Construction spending dynamics have reversed almost completely during the past 12 to 18 months,” said ABC Chief Economist Anirban Basu. “Earlier in the cycle, private construction expanded briskly, driven in part by abundantly available financing at very low interest rates. While private construction volumes continue to be elevated, they are no longer expanding at quite the same rate. For instance, construction spending on lodging and office space barely budged for the month, while commercial construction, such as fulfillment and shopping centers, fell 3.3%.
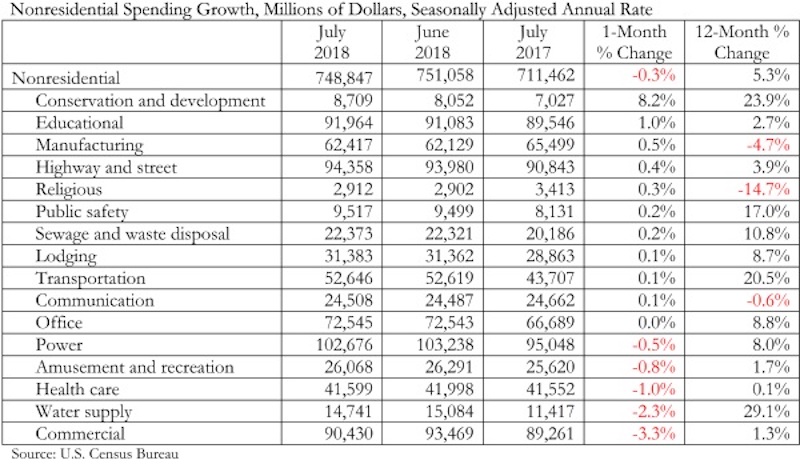
“By contrast, nonresidential construction segments associated with large public components, including conservation and development, education, highway and street, public safety, and sewage and waste disposal all experienced an uptick in spending in July,” said Basu. “Many states are now running budget surpluses for the first time in years, in part due to surging capital gains tax collections. One result is that more public projects are moving forward. As evidence, construction spending in the water supply category is up 29% on a year-over-year basis, conservation and development (e.g. flood control) by 24%, transportation by nearly 21%, public safety-related spending by 17% and sewage and waste disposal by 11%.
“The implication is that the economy’s strong performance is increasingly translating into infrastructure spending, even in the absence of a federal infrastructure package,” said Basu. “Given recent economic and financial market performance, there is every reason to believe that state and local government finances, though still fragile in many instances, will continue to improve. That strongly suggests public construction spending will continue to progress during the months ahead. In constrast, private construction spending growth is more likely to remain constrained for a number of reasons, including recent increases in private borrowing costs and concerns that segments in certain communities are now overbuilt or approaching overbuilt status.”
Related Stories

Market Data | May 13, 2021
Proliferating materials price increases and supply chain disruptions squeeze contractors and threaten to undermine economic recovery
Producer price index data for April shows wide variety of materials with double-digit price increases.

Market Data | May 7, 2021
Construction employment stalls in April
Soaring costs, supply-chain challenges, and workforce shortages undermine industry's recovery.

Market Data | May 4, 2021
Nonresidential construction outlays drop in March for fourth-straight month
Weak demand, supply-chain woes make further declines likely.

Market Data | May 3, 2021
Nonresidential construction spending decreases 1.1% in March
Spending was down on a monthly basis in 11 of the 16 nonresidential subcategories.

Market Data | Apr 30, 2021
New York City market continues to lead the U.S. Construction Pipeline
New York City has the greatest number of projects under construction with 110 projects/19,457 rooms.

Market Data | Apr 29, 2021
U.S. Hotel Construction pipeline beings 2021 with 4,967 projects/622,218 rooms at Q1 close
Although hotel development may still be tepid in Q1, continued government support and the extension of programs has aided many businesses to get back on their feet as more and more are working to re-staff and re-open.

Market Data | Apr 28, 2021
Construction employment declines in 203 metro areas from March 2020 to March 2021
The decline occurs despite homebuilding boom and improving economy.

Market Data | Apr 20, 2021
The pandemic moves subs and vendors closer to technology
Consigli’s latest market outlook identifies building products that are high risk for future price increases.

Market Data | Apr 20, 2021
Demand for design services continues to rapidly escalate
AIA’s ABI score for March rose to 55.6 compared to 53.3 in February.

Market Data | Apr 16, 2021
Construction employment in March trails March 2020 mark in 35 states
Nonresidential projects lag despite hot homebuilding market.


