


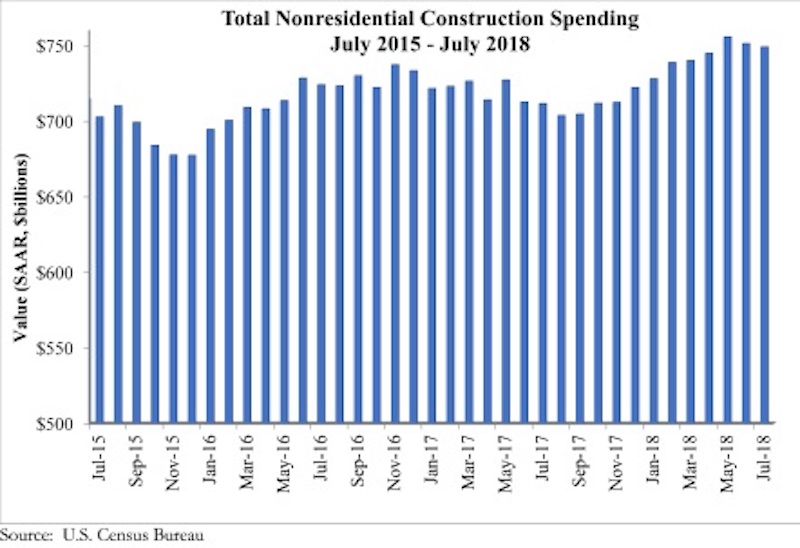
National nonresidential construction spending declined 0.3% in July, according to an Associated Builders and Contractors analysis of U.S. Census Bureau data recently released. Total nonresidential spending stood at $748.8 billion on a seasonally adjusted, annualized rate in July, an increase of 5.3% from the same time last year. Private nonresidential spending fell 1% in July, while public nonresidential spending expanded 0.7%.
“Construction spending dynamics have reversed almost completely during the past 12 to 18 months,” said ABC Chief Economist Anirban Basu. “Earlier in the cycle, private construction expanded briskly, driven in part by abundantly available financing at very low interest rates. While private construction volumes continue to be elevated, they are no longer expanding at quite the same rate. For instance, construction spending on lodging and office space barely budged for the month, while commercial construction, such as fulfillment and shopping centers, fell 3.3%.
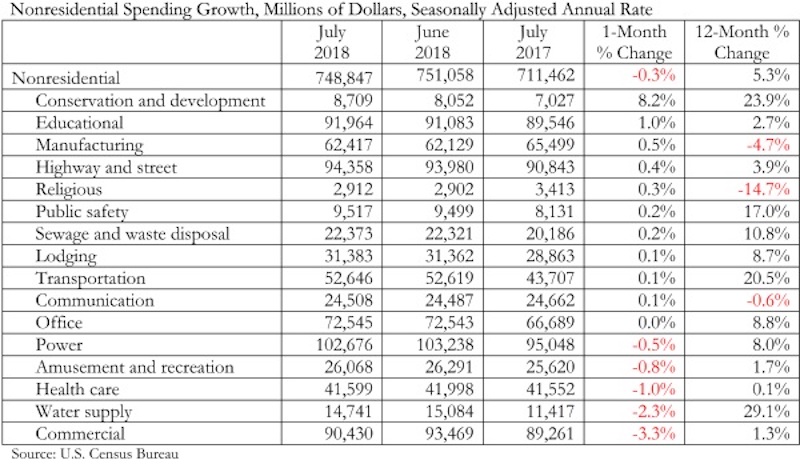
“By contrast, nonresidential construction segments associated with large public components, including conservation and development, education, highway and street, public safety, and sewage and waste disposal all experienced an uptick in spending in July,” said Basu. “Many states are now running budget surpluses for the first time in years, in part due to surging capital gains tax collections. One result is that more public projects are moving forward. As evidence, construction spending in the water supply category is up 29% on a year-over-year basis, conservation and development (e.g. flood control) by 24%, transportation by nearly 21%, public safety-related spending by 17% and sewage and waste disposal by 11%.
“The implication is that the economy’s strong performance is increasingly translating into infrastructure spending, even in the absence of a federal infrastructure package,” said Basu. “Given recent economic and financial market performance, there is every reason to believe that state and local government finances, though still fragile in many instances, will continue to improve. That strongly suggests public construction spending will continue to progress during the months ahead. In constrast, private construction spending growth is more likely to remain constrained for a number of reasons, including recent increases in private borrowing costs and concerns that segments in certain communities are now overbuilt or approaching overbuilt status.”
Related Stories
Market Data | Feb 24, 2021
2021 won’t be a growth year for construction spending, says latest JLL forecast
Predicts second-half improvement toward normalization next year.

Market Data | Feb 23, 2021
Architectural billings continue to contract in 2021
AIA’s Architecture Billings Index (ABI) score for January was 44.9 compared to 42.3 in December.

Healthcare Facilities | Feb 18, 2021
The Weekly show, Feb 18, 2021: What patients want from healthcare facilities, and Post-COVID retail trends
This week on The Weekly show, BD+C editors speak with AEC industry leaders from JLL and Landini Associates about what patients want from healthcare facilities, based on JLL's recent survey of 4,015 patients, and making online sales work for a retail sector recovery.

Market Data | Feb 17, 2021
Soaring prices and delivery delays for lumber and steel squeeze finances for construction firms already hit by pandemic
Association officials call for removing tariffs on key materials to provide immediate relief for hard-hit contractors and exploring ways to expand long-term capacity for steel, lumber and other materials,

Market Data | Feb 9, 2021
Construction Backlog and contractor optimism rise to start 2021, according to ABC member survey
Despite the monthly uptick, backlog is 0.9 months lower than in January 2020.

Market Data | Feb 9, 2021
USGBC top 10 states for LEED in 2020
The Top 10 States for LEED green building is based on gross square feet of certified space per person using 2010 U.S. Census data and includes commercial and institutional projects certified in 2020.

Market Data | Feb 8, 2021
Construction employment stalls in January with unemployment rate of 9.4%
New measures threaten to undermine recovery.

Market Data | Feb 4, 2021
Construction employment declined in 2020 in majority of metro areas
Houston-The Woodlands-Sugar Land and Brockton-Bridgewater-Easton, Mass. have worst 2020 losses, while Indianapolis-Carmel-Anderson, Ind. and Walla Walla, Wash. register largest gains in industry jobs.

Market Data | Feb 3, 2021
Construction spending diverges in December with slump in private nonresidential sector, mixed public work, and boom in homebuilding
Demand for nonresidential construction and public works will decline amid ongoing pandemic concerns.

Market Data | Feb 1, 2021
The New York City market is back on top and leads the U.S. hotel construction pipeline
New York City has the greatest number of projects under construction with 108 projects/19,439 rooms.


