


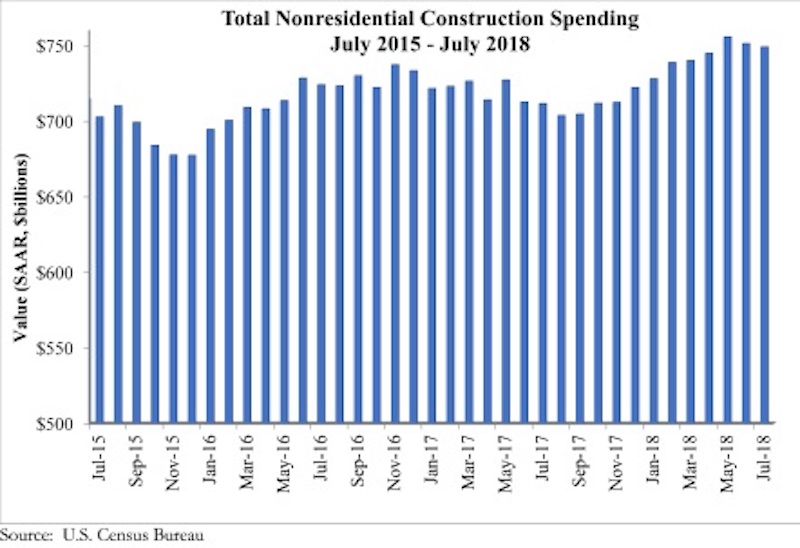
National nonresidential construction spending declined 0.3% in July, according to an Associated Builders and Contractors analysis of U.S. Census Bureau data recently released. Total nonresidential spending stood at $748.8 billion on a seasonally adjusted, annualized rate in July, an increase of 5.3% from the same time last year. Private nonresidential spending fell 1% in July, while public nonresidential spending expanded 0.7%.
“Construction spending dynamics have reversed almost completely during the past 12 to 18 months,” said ABC Chief Economist Anirban Basu. “Earlier in the cycle, private construction expanded briskly, driven in part by abundantly available financing at very low interest rates. While private construction volumes continue to be elevated, they are no longer expanding at quite the same rate. For instance, construction spending on lodging and office space barely budged for the month, while commercial construction, such as fulfillment and shopping centers, fell 3.3%.
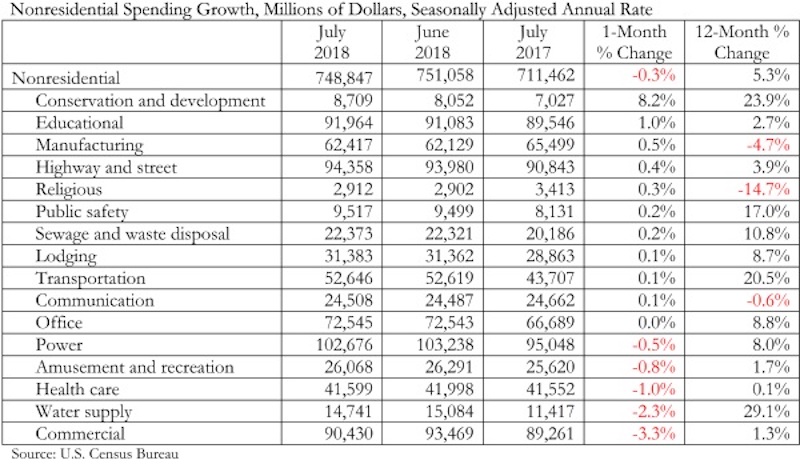
“By contrast, nonresidential construction segments associated with large public components, including conservation and development, education, highway and street, public safety, and sewage and waste disposal all experienced an uptick in spending in July,” said Basu. “Many states are now running budget surpluses for the first time in years, in part due to surging capital gains tax collections. One result is that more public projects are moving forward. As evidence, construction spending in the water supply category is up 29% on a year-over-year basis, conservation and development (e.g. flood control) by 24%, transportation by nearly 21%, public safety-related spending by 17% and sewage and waste disposal by 11%.
“The implication is that the economy’s strong performance is increasingly translating into infrastructure spending, even in the absence of a federal infrastructure package,” said Basu. “Given recent economic and financial market performance, there is every reason to believe that state and local government finances, though still fragile in many instances, will continue to improve. That strongly suggests public construction spending will continue to progress during the months ahead. In constrast, private construction spending growth is more likely to remain constrained for a number of reasons, including recent increases in private borrowing costs and concerns that segments in certain communities are now overbuilt or approaching overbuilt status.”
Related Stories

Market Data | Aug 2, 2021
Nonresidential construction spending falls again in June
The fall was driven by a big drop in funding for highway and street construction and other public work.

Market Data | Jul 29, 2021
Outlook for construction spending improves with the upturn in the economy
The strongest design sector performers for the remainder of this year are expected to be health care facilities.

Market Data | Jul 29, 2021
Construction employment lags or matches pre-pandemic level in 101 metro areas despite housing boom
Eighty metro areas had lower construction employment in June 2021 than February 2020.

Market Data | Jul 28, 2021
Marriott has the largest construction pipeline of U.S. franchise companies in Q2‘21
472 new hotels with 59,034 rooms opened across the United States during the first half of 2021.

Market Data | Jul 27, 2021
New York leads the U.S. hotel construction pipeline at the close of Q2‘21
Many hotel owners, developers, and management groups have used the operational downtime, caused by COVID-19’s impact on operating performance, as an opportunity to upgrade and renovate their hotels and/or redefine their hotels with a brand conversion.

Market Data | Jul 26, 2021
U.S. construction pipeline continues along the road to recovery
During the first and second quarters of 2021, the U.S. opened 472 new hotels with 59,034 rooms.

Market Data | Jul 21, 2021
Architecture Billings Index robust growth continues
AIA’s Architecture Billings Index (ABI) score for June remained at an elevated level of 57.1.

Market Data | Jul 20, 2021
Multifamily proposal activity maintains sizzling pace in Q2
Condos hit record high as all multifamily properties benefit from recovery.

Market Data | Jul 19, 2021
Construction employment trails pre-pandemic level in 39 states
Supply chain challenges, rising materials prices undermine demand.

Market Data | Jul 15, 2021
Producer prices for construction materials and services soar 26% over 12 months
Contractors cope with supply hitches, weak demand.


