


In a recent survey, nearly 900 construction firms reported gains in profitability last year, especially among the top 25% whose financial performances significantly outpaced the respondents as a whole.
The Construction Financial Management Association (CFMA), headquartered in Princeton, N.J., emailed its annual questionnaire to about 8,000 member and nonmember construction firms, as well as member CPA firms that represent construction companies. CFMA received data from 869 companies, which submitted detailed financial statements and other required information.
Thirty-seven percent of the respondents were Industrial & Nonresidential contractors, 19% Heavy & Highway contractors, 43% Specialty Trade contractors, and less than 1% classified as “Other.” The typical company reported total annual sales of $39,710,000 for the 2015 fiscal year. Those with sales under $10 million comprised 16% of responding companies, and 8% of respondents reported sales of over $300 million.
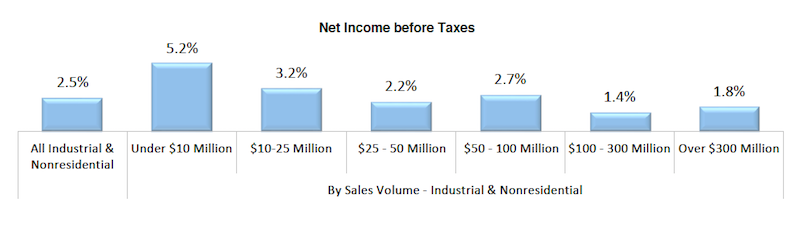
Smaller contracting companies showed stronger earnings last year. Chart: Construction Financial Management Association.
On average, the respondents’ returns on assets and equity rose last year. Returns on Assets was 9%, versus 6.9% in 2014. Returns on equity jumped to 25.3% in 2015, from 19% the previous year.
On the whole, getting paid for services rendered remains a struggle. The respondents’ invoices were in accounts receivable for an average of 55.2 days last year, an increase over the previous two years. As for their accounts payable, the contractors reported a decline to 33.4 days last year, from 35.6 days in 2014.
Gross profits as a percentage of revenue increased to 15%, from 13.1% in 2014. And net income last year stood a 4.4% of sales, versus 3.1% the previous year.
CFMA broke out the financial data by sales volume, and found that companies generating under $10 million in revenue generally had higher profitability ratios than other cohorts. Perhaps coincidentally, the smaller companies had lower debt-to-equity ratios, and significantly lower “underbillings-to-equity” ratios (4.4%, compared to 15.6% for companies with $300 million or more in annual revenue).
Conversely, the largest companies by revenue were more productive, reporting sales per employee of $751,348 ($276,000 more per employee than companies with between $100 million and $300 million in sales, and even higher compared to the other groups), and gross profit per employee of $71,851.
The top-performing contractors—based on a composite ranking of five performance metrics (ROA, ROE, debt to equity, fixed-asset ratios, and gross profit per employee)—were head and shoulders above respondent averages.
The highest achievers reported a 24% Return on Assets and 58.5% Return on Equity, substantively higher on both counts than the survey’s averages noted above.
Best in Class companies also reported less debt (1.2 times debt-to-equity versus 1.8 times for all respondents) and a more stable fixed asset ratio (16.6% versus 25.1% for all respondents). All respondents averaged a 15% gross profit margin, while the Best in Class companies achieved an 18.4% margin. Further, all respondents earned a 4.4% net income before taxes, compared with the highest achievers, which averaged 8.4% margin.
The CFMA survey was compiled and analyzed by Industry Insights and the organization’s Financial Survey & Benchmarker Committee. It did not provide explanations about why some contractors performed better than others.
Related Stories

BIM and Information Technology | Oct 29, 2015
MIT develops ‘river of 3D pixels’ to assemble objects
The Kinetic Blocks can manipulate objects into shapes without human interference.

Contractors | Oct 28, 2015
Office construction costs highest in New York City, San Francisco, says CBRE
A CBRE report found that New York’s construction costs are more than $500 per sf. San Francisco isn’t too far behind.

Contractors | Oct 16, 2015
ABC report: Confidence rises during the first half of the year
In the first half, sales expectations and profit margin expectations rose while staffing level intentions dipped slightly.

Contractors | Oct 7, 2015
Construction equipment continues to be vulnerable to theft
Poor security and lax inventory control make jobsites sitting ducks for robbers, according to crime-data analysis by LoJack.

Office Buildings | Oct 5, 2015
Renderings revealed for Apple's second 'spaceship': a curvy, lush office complex in Sunnyvale
The project has been dubbed as another “spaceship,” referencing the nickname for the loop-shaped Apple Campus under construction in Cupertino.

Contractors | Oct 2, 2015
OSHA’s top 10 workplace safety violations for 2015
Fall protection, hazard communication lead the list.

Contractors | Oct 1, 2015
Nonresidential construction spending expands for seventh consecutive month
Spending totaled $696.3 billion on a seasonally adjusted, annualized basis in August, a 0.3% increase from the previous month.

Airports | Sep 30, 2015
Takeoff! 5 ways high-flyin' airports are designing for rapid growth
Nimble designs, and technology that humanizes the passenger experience, are letting airports concentrate on providing service and generating revenue.

Contractors | Sep 30, 2015
FMI: Construction in place on track for sustained growth through 2016
FMI’s latest report singles out manufacturing, lodging, and office sectors as the drivers of nonresidential building activity and investment.
![What went wrong? Diagnosing building envelope distress [AIA course]](/sites/default/files/styles/list_big/public/Screen%20shot%202015-09-29%20at%209.46.33%20AM.png?itok=QDq8CQJv "What went wrong? Diagnosing building envelope distress [AIA course]")
Reconstruction & Renovation | Sep 29, 2015
What went wrong? Diagnosing building envelope distress [AIA course]
With so many diverse components contributing to building envelope assemblies, it can be challenging to determine which of these myriad elements was the likely cause of a failure.


