


In a recent survey, nearly 900 construction firms reported gains in profitability last year, especially among the top 25% whose financial performances significantly outpaced the respondents as a whole.
The Construction Financial Management Association (CFMA), headquartered in Princeton, N.J., emailed its annual questionnaire to about 8,000 member and nonmember construction firms, as well as member CPA firms that represent construction companies. CFMA received data from 869 companies, which submitted detailed financial statements and other required information.
Thirty-seven percent of the respondents were Industrial & Nonresidential contractors, 19% Heavy & Highway contractors, 43% Specialty Trade contractors, and less than 1% classified as “Other.” The typical company reported total annual sales of $39,710,000 for the 2015 fiscal year. Those with sales under $10 million comprised 16% of responding companies, and 8% of respondents reported sales of over $300 million.
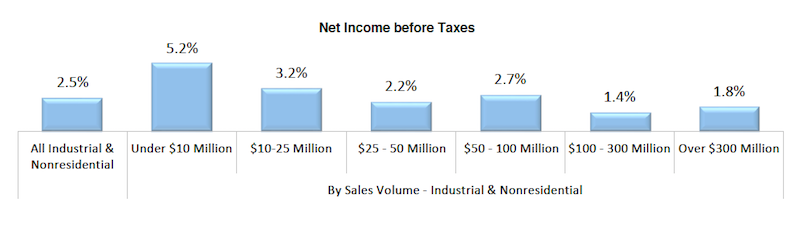
Smaller contracting companies showed stronger earnings last year. Chart: Construction Financial Management Association.
On average, the respondents’ returns on assets and equity rose last year. Returns on Assets was 9%, versus 6.9% in 2014. Returns on equity jumped to 25.3% in 2015, from 19% the previous year.
On the whole, getting paid for services rendered remains a struggle. The respondents’ invoices were in accounts receivable for an average of 55.2 days last year, an increase over the previous two years. As for their accounts payable, the contractors reported a decline to 33.4 days last year, from 35.6 days in 2014.
Gross profits as a percentage of revenue increased to 15%, from 13.1% in 2014. And net income last year stood a 4.4% of sales, versus 3.1% the previous year.
CFMA broke out the financial data by sales volume, and found that companies generating under $10 million in revenue generally had higher profitability ratios than other cohorts. Perhaps coincidentally, the smaller companies had lower debt-to-equity ratios, and significantly lower “underbillings-to-equity” ratios (4.4%, compared to 15.6% for companies with $300 million or more in annual revenue).
Conversely, the largest companies by revenue were more productive, reporting sales per employee of $751,348 ($276,000 more per employee than companies with between $100 million and $300 million in sales, and even higher compared to the other groups), and gross profit per employee of $71,851.
The top-performing contractors—based on a composite ranking of five performance metrics (ROA, ROE, debt to equity, fixed-asset ratios, and gross profit per employee)—were head and shoulders above respondent averages.
The highest achievers reported a 24% Return on Assets and 58.5% Return on Equity, substantively higher on both counts than the survey’s averages noted above.
Best in Class companies also reported less debt (1.2 times debt-to-equity versus 1.8 times for all respondents) and a more stable fixed asset ratio (16.6% versus 25.1% for all respondents). All respondents averaged a 15% gross profit margin, while the Best in Class companies achieved an 18.4% margin. Further, all respondents earned a 4.4% net income before taxes, compared with the highest achievers, which averaged 8.4% margin.
The CFMA survey was compiled and analyzed by Industry Insights and the organization’s Financial Survey & Benchmarker Committee. It did not provide explanations about why some contractors performed better than others.
Related Stories

Contractors | Dec 1, 2015
ABC: September's nonresidential spending retains momentum in October
Spending increased in 10 of 16 nonresidential construction sectors on a monthly basis.

Greenbuild Report | Dec 1, 2015
Data centers turn to alternative power sources, new heat controls and UPS systems
Data centers account for 2% of the nation’s electricity consumption and about 30% of the power used annually by the economy’s information and communications technology sector, according to the National Renewable Energy Laboratory.
![The contractor’s role in promoting job site sustainability [AIA course]](/sites/default/files/styles/list_big/public/Screen%20Shot%202015-12-01%20at%209.07.23%20AM.png?itok=UyfyfxCn "The contractor’s role in promoting job site sustainability [AIA course]")
Contractors | Dec 1, 2015
The contractor’s role in promoting job site sustainability [AIA course]
Robins & Morton’s Jackie Mustakas offers specific actions that contractors and construction managers can take to green every job site.

Contractors | Nov 30, 2015
Sundt Construction opens its own craft employee training center
The contractor's Center for Craft Excellence, in Phoenix, is in response to the labor shortages in the industry.

Contractors | Nov 24, 2015
FMI survey: Millennials in construction get a bad rap, tend to be loyal, hard-working
While the stigma exists that Millennials are entitled, disloyal, and lazy, it appears that this is not true, according to a new report from FMI.

Contractors | Nov 12, 2015
Construction will outpace worldwide GDP growth over the next 15 years
Three countries—the United States, China, and India—will account for nearly three-fifths of worldwide construction growth over the next 15 years, according to a new report from Global Construction Perspectives and Oxford Economics.

Contractors | Nov 5, 2015
Budget bill provision raises OSHA fines for first time in 25 years
Inflation-adjusted penalty hikes could go up as much as 80%.

Contractors | Nov 3, 2015
ABC, AIA & NAHB: Residential, nonresidential construction growth expected in 2016
Economists from the three trade associations discussed several indicators for sector performance in a joint web conference.

Contractors | Nov 2, 2015
ABC: September's nonresidential spending slip no cause for concern
Despite the monthly drop, September's year-over-year increase is largest in seven years. Seven of 16 nonresidential construction sectors saw spending increases.

Contractors | Oct 30, 2015
ABC: Economic growth stronger than headline GDP figure suggests
GDP expanded 1.5% during the third quarter while nonresidential fixed investment expanded by 2.1% during that period.


