


In a recent survey, nearly 900 construction firms reported gains in profitability last year, especially among the top 25% whose financial performances significantly outpaced the respondents as a whole.
The Construction Financial Management Association (CFMA), headquartered in Princeton, N.J., emailed its annual questionnaire to about 8,000 member and nonmember construction firms, as well as member CPA firms that represent construction companies. CFMA received data from 869 companies, which submitted detailed financial statements and other required information.
Thirty-seven percent of the respondents were Industrial & Nonresidential contractors, 19% Heavy & Highway contractors, 43% Specialty Trade contractors, and less than 1% classified as “Other.” The typical company reported total annual sales of $39,710,000 for the 2015 fiscal year. Those with sales under $10 million comprised 16% of responding companies, and 8% of respondents reported sales of over $300 million.
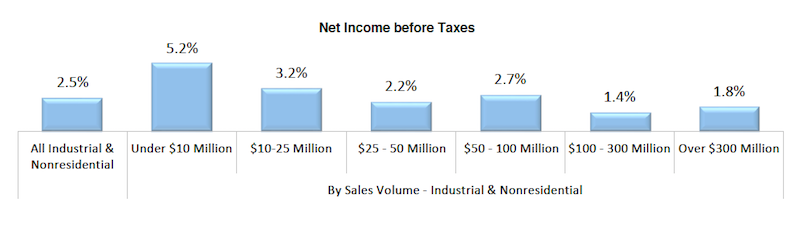
Smaller contracting companies showed stronger earnings last year. Chart: Construction Financial Management Association.
On average, the respondents’ returns on assets and equity rose last year. Returns on Assets was 9%, versus 6.9% in 2014. Returns on equity jumped to 25.3% in 2015, from 19% the previous year.
On the whole, getting paid for services rendered remains a struggle. The respondents’ invoices were in accounts receivable for an average of 55.2 days last year, an increase over the previous two years. As for their accounts payable, the contractors reported a decline to 33.4 days last year, from 35.6 days in 2014.
Gross profits as a percentage of revenue increased to 15%, from 13.1% in 2014. And net income last year stood a 4.4% of sales, versus 3.1% the previous year.
CFMA broke out the financial data by sales volume, and found that companies generating under $10 million in revenue generally had higher profitability ratios than other cohorts. Perhaps coincidentally, the smaller companies had lower debt-to-equity ratios, and significantly lower “underbillings-to-equity” ratios (4.4%, compared to 15.6% for companies with $300 million or more in annual revenue).
Conversely, the largest companies by revenue were more productive, reporting sales per employee of $751,348 ($276,000 more per employee than companies with between $100 million and $300 million in sales, and even higher compared to the other groups), and gross profit per employee of $71,851.
The top-performing contractors—based on a composite ranking of five performance metrics (ROA, ROE, debt to equity, fixed-asset ratios, and gross profit per employee)—were head and shoulders above respondent averages.
The highest achievers reported a 24% Return on Assets and 58.5% Return on Equity, substantively higher on both counts than the survey’s averages noted above.
Best in Class companies also reported less debt (1.2 times debt-to-equity versus 1.8 times for all respondents) and a more stable fixed asset ratio (16.6% versus 25.1% for all respondents). All respondents averaged a 15% gross profit margin, while the Best in Class companies achieved an 18.4% margin. Further, all respondents earned a 4.4% net income before taxes, compared with the highest achievers, which averaged 8.4% margin.
The CFMA survey was compiled and analyzed by Industry Insights and the organization’s Financial Survey & Benchmarker Committee. It did not provide explanations about why some contractors performed better than others.
Related Stories

Contractors | Jan 11, 2016
Novum Structures will pay $3 million to settle violations of ‘Buy American’ regulations
Wisconsin design and construction firm charged with repackaging materials from foreign sources.

Market Data | Jan 6, 2016
Census Bureau revises 10 years’ worth of construction spending figures
The largest revisions came in the last two years and were largely upward.

Market Data | Jan 5, 2016
Majority of AEC firms saw growth in 2015, remain optimistic for 2016: BD+C survey
By all indications, 2015 was another solid year for U.S. architecture, engineering, and construction firms.

Architects | Jan 5, 2016
Potential vs. credential: How men and women differ in career progress
Recent research suggests that women face yet another career impediment: the confidence gap.

Urban Planning | Jan 4, 2016
The next boomtown? Construction and redevelopment sizzle in San Diego
The city's emission-reduction plan could drive influx into downtown

Market Data | Dec 15, 2015
AIA: Architecture Billings Index hits another bump
Business conditions show continued strength in South and West regions.

Industry Research | Dec 8, 2015
AEC leaders say the 'talent wars' are heating up: BD+C exclusive survey
A new survey from Building Design+Construction shows that U.S. architecture, engineering, and construction firms are being stymied by the shortage of experienced design and construction professionals and project managers.

Market Data | Dec 7, 2015
2016 forecast: Continued growth expected for the construction industry
ABC forecasts growth in nonresidential construction spending of 7.4% in 2016 along with growth in employment and backlog.

Contractors | Dec 2, 2015
FMI: Nonresidential construction in a slowdown, according to latest NRCI score
“Economic recovery momentum is losing steam and rising costs in labor and materials start to put a load on the industry,” said Chris Daum, President and CEO of FMI.

Contractors | Dec 2, 2015
ABC releases scorecard on state policies affecting the construction industry
The scorecard website identifies states that have good environments for merit shop contractors, like Arizona, and states that could improve conditions, like New York.


