


In a recent survey, nearly 900 construction firms reported gains in profitability last year, especially among the top 25% whose financial performances significantly outpaced the respondents as a whole.
The Construction Financial Management Association (CFMA), headquartered in Princeton, N.J., emailed its annual questionnaire to about 8,000 member and nonmember construction firms, as well as member CPA firms that represent construction companies. CFMA received data from 869 companies, which submitted detailed financial statements and other required information.
Thirty-seven percent of the respondents were Industrial & Nonresidential contractors, 19% Heavy & Highway contractors, 43% Specialty Trade contractors, and less than 1% classified as “Other.” The typical company reported total annual sales of $39,710,000 for the 2015 fiscal year. Those with sales under $10 million comprised 16% of responding companies, and 8% of respondents reported sales of over $300 million.
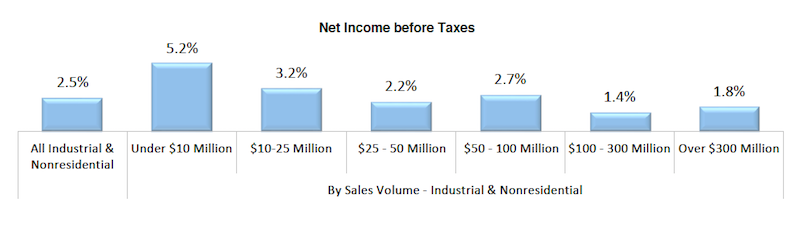
Smaller contracting companies showed stronger earnings last year. Chart: Construction Financial Management Association.
On average, the respondents’ returns on assets and equity rose last year. Returns on Assets was 9%, versus 6.9% in 2014. Returns on equity jumped to 25.3% in 2015, from 19% the previous year.
On the whole, getting paid for services rendered remains a struggle. The respondents’ invoices were in accounts receivable for an average of 55.2 days last year, an increase over the previous two years. As for their accounts payable, the contractors reported a decline to 33.4 days last year, from 35.6 days in 2014.
Gross profits as a percentage of revenue increased to 15%, from 13.1% in 2014. And net income last year stood a 4.4% of sales, versus 3.1% the previous year.
CFMA broke out the financial data by sales volume, and found that companies generating under $10 million in revenue generally had higher profitability ratios than other cohorts. Perhaps coincidentally, the smaller companies had lower debt-to-equity ratios, and significantly lower “underbillings-to-equity” ratios (4.4%, compared to 15.6% for companies with $300 million or more in annual revenue).
Conversely, the largest companies by revenue were more productive, reporting sales per employee of $751,348 ($276,000 more per employee than companies with between $100 million and $300 million in sales, and even higher compared to the other groups), and gross profit per employee of $71,851.
The top-performing contractors—based on a composite ranking of five performance metrics (ROA, ROE, debt to equity, fixed-asset ratios, and gross profit per employee)—were head and shoulders above respondent averages.
The highest achievers reported a 24% Return on Assets and 58.5% Return on Equity, substantively higher on both counts than the survey’s averages noted above.
Best in Class companies also reported less debt (1.2 times debt-to-equity versus 1.8 times for all respondents) and a more stable fixed asset ratio (16.6% versus 25.1% for all respondents). All respondents averaged a 15% gross profit margin, while the Best in Class companies achieved an 18.4% margin. Further, all respondents earned a 4.4% net income before taxes, compared with the highest achievers, which averaged 8.4% margin.
The CFMA survey was compiled and analyzed by Industry Insights and the organization’s Financial Survey & Benchmarker Committee. It did not provide explanations about why some contractors performed better than others.
Related Stories

Contractors | Aug 19, 2015
FMI's Nonresidential Construction Index Report: Recovery continues despite slow down
The Q3 NRCI dropped to 63.6 from the previous reading of 64.9 in Q2, painting a mixed picture of the state of the nonresidential construction sector.

Giants 400 | Aug 7, 2015
GOVERNMENT SECTOR GIANTS: Public sector spending even more cautiously on buildings
AEC firms that do government work say their public-sector clients have been going smaller to save money on construction projects, according to BD+C's 2015 Giants 300 report.

Giants 400 | Aug 7, 2015
K-12 SCHOOL SECTOR GIANTS: To succeed, school design must replicate real-world environments
Whether new or reconstructed, schools must meet new demands that emanate from the real world and rapidly adapt to different instructional and learning modes, according to BD+C's 2015 Giants 300 report.

Giants 400 | Aug 7, 2015
MULTIFAMILY AEC GIANTS: Slowdown prompts developers to ask: Will the luxury rentals boom hold?
For the last three years, rental apartments have occupied the hot corner in residential construction, as younger people gravitated toward renting to be closer to urban centers and jobs. But at around 360,000 annual starts, multifamily might be peaking, according to BD+C's 2015 Giants 300 report.

Giants 400 | Aug 7, 2015
UNIVERSITY SECTOR GIANTS: Collaboration, creativity, technology—hallmarks of today’s campus facilities
At a time when competition for the cream of the student/faculty crop is intensifying, colleges and universities must recognize that students and parents are coming to expect an education environment that foments collaboration, according to BD+C's 2015 Giants 300 report.

Giants 400 | Aug 7, 2015
RECONSTRUCTION AEC GIANTS: Restorations breathe new life into valuable older buildings
AEC Giants discuss opportunities and complications associated with renovation, restoration, and adaptive reuse construction work.

Giants 400 | Aug 6, 2015
BIM GIANTS: Robotic reality capture, gaming systems, virtual reality—AEC Giants continue tech frenzy
Given their size, AEC Giants possess the resources and scale to research and test the bevy of software and hardware solutions on the market. Some have created internal innovation labs and fabrication shops to tinker with emerging technologies and create custom software tools. Others have formed R&D teams to test tech tools on the job site.

Giants 400 | Aug 6, 2015
GIANTS 300 REPORT: Top 75 Healthcare Construction Firms
Turner, McCarthy, and Skanska top Building Design+Construction's 2015 ranking of the largest healthcare contractors and construction management firms in the U.S.

Giants 400 | Aug 6, 2015
HEALTHCARE AEC GIANTS: Hospital and medical office construction facing a slow but steady recovery
Construction of hospitals and medical offices is expected to shake off its lethargy in 2015 and recover modestly over the next several years, according to BD+C's 2015 Giants 300 report.

Giants 400 | Aug 6, 2015
GIANTS 300 REPORT: Top 75 Construction Management Firms
Jacobs, AECOM, and Hill International head Building Design+Construction's 2015 ranking of the largest construction management and project management firms in the United States.


