


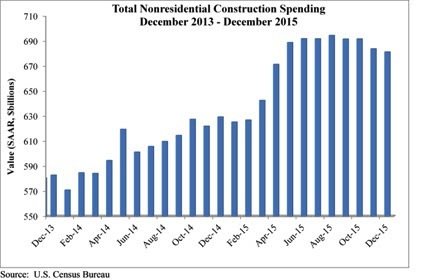
Nonresidential construction spending crested the $700 billion mark on a seasonally adjusted annualized basis in January for the first time since March 2009, according to analysis of U.S. Census Bureau data released today by Associated Builders and Contractors (ABC).
Nonresidential construction spending expanded 2.5% on a monthly basis and 12.3% on a yearly basis, totaling $701.9 billion. The Census Bureau upwardly revised December's estimate from $681.2 billion to $684.5 billion, though they downgraded November's figure from $683.7 to $680.5 million. Private nonresidential construction spending increased by 1% for the month, while its public counterpart expanded by 4.6%.
"After several months of relatively weak nonresidential construction spending data, today's data release was most welcome," ABC Chief Economist Anirban Basu said. "While January is a difficult month to interpret and one that should not be overly emphasized, the fact of the matter is that the year-over-year performance in spending is consistent with a host of industry indicators. For many months, the average contractor has been reporting decent backlog. Measures of industry confidence have remained stable even in the face of adverse news coming from various parts of the world.
"While the nonresidential construction spending recovery appears to remain in place, the industry's overall outlook remains murky," Basu said. "The global economy remains weak, and domestic corporate profitability has been slipping. The U.S. economic recovery continues to be under-diversified, with consumers continuing to lead the way. If corporate profitability continues to struggle, given falling exports and a general lack of confidence among CEOs, the pace of employment growth will slow over the course of 2016. That will presumably affect consumer spending, which is already being hampered by rising health care costs. That, in turn, could jeopardize the ongoing economic recovery, now on its way to completing its seventh year."
Spending increased in January on a monthly basis in 10 of 16 nonresidential construction sectors:
- Spending in the highway and street category expanded 14.6% from December 2015 and is 33.9 higher than in January 2015.
- Sewage and waste disposal-related spending expanded 4% for the month and 1.4% from the same time last year.
- Spending in the amusement and recreation category climbed 0.7% on a monthly basis and 16.9% on a year-over-year basis.
- Conservation and development-related spending is 10% higher on a monthly basis and 1.6% higher on a yearly basis.
- Lodging-related spending is up 6.3% for the month and is up 34.8% on a year-ago basis.
- Spending in the religious category grew 4.2% for the month and 0.2% from January 2015.
- Manufacturing-related spending expanded 4.2% on a monthly basis and is up 11.3% on a yearly basis.
- Spending in the power category expanded 2.9% from December 2015 and is 8.1% higher than in January 2015.
- Water supply-related spending expanded 2% on a monthly basis but fell 7.9% on a yearly basis.
- Spending in the office category grew 0.2% from December 2015 and is up 19.6% from January 2015.
Spending in six of the nonresidential construction subsectors fell in January on a monthly basis:
- Commercial-related construction spending fell 4.3% for the month but grew 0.8% on a year-over-year basis.
- Educational-related construction spending fell 1.1% on a monthly basis, but expanded 12.1% on a yearly basis.
- Transportation-related spending fell 2.5% month-over-month, but expanded 0.6% year-over-year.
- Health care-related spending fell 0.1% month-over-month but is up 1.8% year-over-year.
- Public safety-related spending is down 1.5% for the month and 3.2% from the same time one year ago.
- Communication-related spending fell by 4.2% month-over-month but expanded 27.2% year-over-year.
Related Stories

Market Data | Dec 19, 2018
When it comes to economic clout, New York will far outpace other U.S. metros for decades to come
But San Jose, Calif., is expected to have the best annual growth rate through 2035, according to Oxford Economics’ latest Global Cities report.

Market Data | Dec 19, 2018
Run of positive billings continues at architecture firms
November marked the fourteenth consecutive month of increasing demand for architectural firm services.

Market Data | Dec 5, 2018
ABC predicts construction sector will remain strong in 2019
Job growth, high backlog and healthy infrastructure investment all spell good news for the industry.

Market Data | Dec 4, 2018
Nonresidential spending rises modestly in October
Thirteen out of 16 subsectors are associated with year-over-year increases.

Market Data | Nov 20, 2018
Construction employment rises from October 2017 to October 2018 in 44 states and D.C.
Texas has biggest annual job increase while New Jersey continues losses; Iowa, Florida and California have largest one-month gains as Mississippi and Louisiana trail.

Market Data | Nov 15, 2018
Architecture firm billings continue to slow, but remain positive in October
Southern region reports decline in billings for the first time since June 2012.

Market Data | Nov 14, 2018
A new Joint Center report finds aging Americans less prepared to afford housing
The study foresees a significant segment of seniors struggling to buy or rent on their own or with other people.

Market Data | Nov 12, 2018
Leading hotel markets in the U.S. construction pipeline
Projects already under construction and those scheduled to start construction in the next 12 months, combined, have a total of 3,782 projects/213,798 rooms and are at cyclical highs.

Market Data | Nov 6, 2018
Unflagging national office market enjoys economic tailwinds
Stable vacancy helped push asking rents 4% higher in third quarter.

Market Data | Nov 2, 2018
Nonresidential spending retains momentum in September, up 8.9% year over year
Total nonresidential spending stood at $767.1 billion on a seasonally adjusted, annualized rate in September.


