


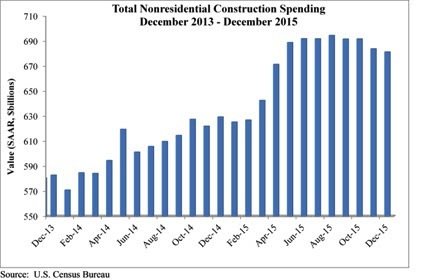
Nonresidential construction spending crested the $700 billion mark on a seasonally adjusted annualized basis in January for the first time since March 2009, according to analysis of U.S. Census Bureau data released today by Associated Builders and Contractors (ABC).
Nonresidential construction spending expanded 2.5% on a monthly basis and 12.3% on a yearly basis, totaling $701.9 billion. The Census Bureau upwardly revised December's estimate from $681.2 billion to $684.5 billion, though they downgraded November's figure from $683.7 to $680.5 million. Private nonresidential construction spending increased by 1% for the month, while its public counterpart expanded by 4.6%.
"After several months of relatively weak nonresidential construction spending data, today's data release was most welcome," ABC Chief Economist Anirban Basu said. "While January is a difficult month to interpret and one that should not be overly emphasized, the fact of the matter is that the year-over-year performance in spending is consistent with a host of industry indicators. For many months, the average contractor has been reporting decent backlog. Measures of industry confidence have remained stable even in the face of adverse news coming from various parts of the world.
"While the nonresidential construction spending recovery appears to remain in place, the industry's overall outlook remains murky," Basu said. "The global economy remains weak, and domestic corporate profitability has been slipping. The U.S. economic recovery continues to be under-diversified, with consumers continuing to lead the way. If corporate profitability continues to struggle, given falling exports and a general lack of confidence among CEOs, the pace of employment growth will slow over the course of 2016. That will presumably affect consumer spending, which is already being hampered by rising health care costs. That, in turn, could jeopardize the ongoing economic recovery, now on its way to completing its seventh year."
Spending increased in January on a monthly basis in 10 of 16 nonresidential construction sectors:
- Spending in the highway and street category expanded 14.6% from December 2015 and is 33.9 higher than in January 2015.
- Sewage and waste disposal-related spending expanded 4% for the month and 1.4% from the same time last year.
- Spending in the amusement and recreation category climbed 0.7% on a monthly basis and 16.9% on a year-over-year basis.
- Conservation and development-related spending is 10% higher on a monthly basis and 1.6% higher on a yearly basis.
- Lodging-related spending is up 6.3% for the month and is up 34.8% on a year-ago basis.
- Spending in the religious category grew 4.2% for the month and 0.2% from January 2015.
- Manufacturing-related spending expanded 4.2% on a monthly basis and is up 11.3% on a yearly basis.
- Spending in the power category expanded 2.9% from December 2015 and is 8.1% higher than in January 2015.
- Water supply-related spending expanded 2% on a monthly basis but fell 7.9% on a yearly basis.
- Spending in the office category grew 0.2% from December 2015 and is up 19.6% from January 2015.
Spending in six of the nonresidential construction subsectors fell in January on a monthly basis:
- Commercial-related construction spending fell 4.3% for the month but grew 0.8% on a year-over-year basis.
- Educational-related construction spending fell 1.1% on a monthly basis, but expanded 12.1% on a yearly basis.
- Transportation-related spending fell 2.5% month-over-month, but expanded 0.6% year-over-year.
- Health care-related spending fell 0.1% month-over-month but is up 1.8% year-over-year.
- Public safety-related spending is down 1.5% for the month and 3.2% from the same time one year ago.
- Communication-related spending fell by 4.2% month-over-month but expanded 27.2% year-over-year.
Related Stories

Market Data | Aug 10, 2018
Construction material prices inch down in July
Nonresidential construction input prices increased fell 0.3% in July but are up 9.6% year over year.

Market Data | Aug 9, 2018
Projections reveal nonresidential construction spending to grow
AIA releases latest Consensus Construction Forecast.
Market Data | Aug 7, 2018
New supply's impact illustrated in Yardi Matrix national self storage report for July
The metro with the most units under construction and planned as a percent of existing inventory in mid-July was Nashville, Tenn.

Market Data | Aug 3, 2018
U.S. multifamily rents reach new heights in July
Favorable economic conditions produce a sunny summer for the apartment sector.

Market Data | Aug 2, 2018
Nonresidential construction spending dips in June
“The hope is that June’s construction spending setback is merely a statistical aberration,” said ABC Chief Economist Anirban Basu.

Market Data | Aug 1, 2018
U.S. hotel construction pipeline continues moderate growth year-over-year
The hotel construction pipeline has been growing moderately and incrementally each quarter.

Market Data | Jul 30, 2018
Nonresidential fixed investment surges in second quarter
Nonresidential fixed investment represented an especially important element of second quarter strength in the advance estimate.

Market Data | Jul 11, 2018
Construction material prices increase steadily in June
June represents the latest month associated with rapidly rising construction input prices.

Market Data | Jun 26, 2018
Yardi Matrix examines potential regional multifamily supply overload
Outsize development activity in some major metros could increase vacancy rates and stagnate rent growth.

Market Data | Jun 22, 2018
Multifamily market remains healthy – Can it be sustained?
New report says strong economic fundamentals outweigh headwinds.


