


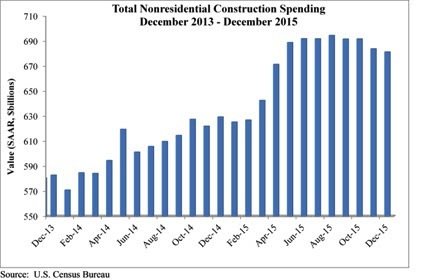
Nonresidential construction spending crested the $700 billion mark on a seasonally adjusted annualized basis in January for the first time since March 2009, according to analysis of U.S. Census Bureau data released today by Associated Builders and Contractors (ABC).
Nonresidential construction spending expanded 2.5% on a monthly basis and 12.3% on a yearly basis, totaling $701.9 billion. The Census Bureau upwardly revised December's estimate from $681.2 billion to $684.5 billion, though they downgraded November's figure from $683.7 to $680.5 million. Private nonresidential construction spending increased by 1% for the month, while its public counterpart expanded by 4.6%.
"After several months of relatively weak nonresidential construction spending data, today's data release was most welcome," ABC Chief Economist Anirban Basu said. "While January is a difficult month to interpret and one that should not be overly emphasized, the fact of the matter is that the year-over-year performance in spending is consistent with a host of industry indicators. For many months, the average contractor has been reporting decent backlog. Measures of industry confidence have remained stable even in the face of adverse news coming from various parts of the world.
"While the nonresidential construction spending recovery appears to remain in place, the industry's overall outlook remains murky," Basu said. "The global economy remains weak, and domestic corporate profitability has been slipping. The U.S. economic recovery continues to be under-diversified, with consumers continuing to lead the way. If corporate profitability continues to struggle, given falling exports and a general lack of confidence among CEOs, the pace of employment growth will slow over the course of 2016. That will presumably affect consumer spending, which is already being hampered by rising health care costs. That, in turn, could jeopardize the ongoing economic recovery, now on its way to completing its seventh year."
Spending increased in January on a monthly basis in 10 of 16 nonresidential construction sectors:
- Spending in the highway and street category expanded 14.6% from December 2015 and is 33.9 higher than in January 2015.
- Sewage and waste disposal-related spending expanded 4% for the month and 1.4% from the same time last year.
- Spending in the amusement and recreation category climbed 0.7% on a monthly basis and 16.9% on a year-over-year basis.
- Conservation and development-related spending is 10% higher on a monthly basis and 1.6% higher on a yearly basis.
- Lodging-related spending is up 6.3% for the month and is up 34.8% on a year-ago basis.
- Spending in the religious category grew 4.2% for the month and 0.2% from January 2015.
- Manufacturing-related spending expanded 4.2% on a monthly basis and is up 11.3% on a yearly basis.
- Spending in the power category expanded 2.9% from December 2015 and is 8.1% higher than in January 2015.
- Water supply-related spending expanded 2% on a monthly basis but fell 7.9% on a yearly basis.
- Spending in the office category grew 0.2% from December 2015 and is up 19.6% from January 2015.
Spending in six of the nonresidential construction subsectors fell in January on a monthly basis:
- Commercial-related construction spending fell 4.3% for the month but grew 0.8% on a year-over-year basis.
- Educational-related construction spending fell 1.1% on a monthly basis, but expanded 12.1% on a yearly basis.
- Transportation-related spending fell 2.5% month-over-month, but expanded 0.6% year-over-year.
- Health care-related spending fell 0.1% month-over-month but is up 1.8% year-over-year.
- Public safety-related spending is down 1.5% for the month and 3.2% from the same time one year ago.
- Communication-related spending fell by 4.2% month-over-month but expanded 27.2% year-over-year.
Related Stories

Market Data | Jun 21, 2018
Architecture firm billings strengthen in May
Architecture Billings Index enters eighth straight month of solid growth.

Market Data | Jun 20, 2018
7% year-over-year growth in the global construction pipeline
There are 5,952 projects/1,115,288 rooms under construction, up 8% by projects YOY.

Market Data | Jun 19, 2018
ABC’s Construction Backlog Indicator remains elevated in first quarter of 2018
The CBI shows highlights by region, industry, and company size.

Market Data | Jun 19, 2018
America’s housing market still falls short of providing affordable shelter to many
The latest report from the Joint Center for Housing Studies laments the paucity of subsidies to relieve cost burdens of ownership and renting.

Market Data | Jun 18, 2018
AI is the path to maximum profitability for retail and FMCG firms
Leading retailers including Amazon, Alibaba, Lowe’s and Tesco are developing their own AI solutions for automation, analytics and robotics use cases.

Market Data | Jun 12, 2018
Yardi Matrix report details industrial sector's strength
E-commerce and biopharmaceutical companies seeking space stoke record performances across key indicators.

Market Data | Jun 8, 2018
Dodge Momentum Index inches up in May
May’s gain was the result of a 4.7% increase by the commercial component of the Momentum Index.

Market Data | Jun 4, 2018
Nonresidential construction remains unchanged in April
Private sector spending increased 0.8% on a monthly basis and is up 5.3% from a year ago.

Market Data | May 30, 2018
Construction employment increases in 256 metro areas between April 2017 & 2018
Dallas-Plano-Irving and Midland, Texas experience largest year-over-year gains; St. Louis, Mo.-Ill. and Bloomington, Ill. have biggest annual declines in construction employment amid continuing demand.

Market Data | May 29, 2018
America’s fastest-growing cities: San Antonio, Phoenix lead population growth
San Antonio added 24,208 people between July 2016 and July 2017, according to U.S. Census Bureau data.


