


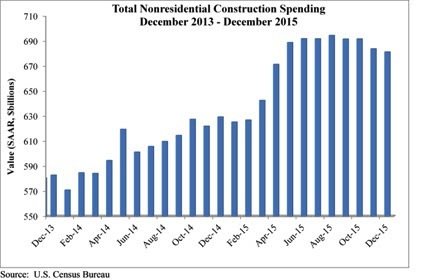
Nonresidential construction spending crested the $700 billion mark on a seasonally adjusted annualized basis in January for the first time since March 2009, according to analysis of U.S. Census Bureau data released today by Associated Builders and Contractors (ABC).
Nonresidential construction spending expanded 2.5% on a monthly basis and 12.3% on a yearly basis, totaling $701.9 billion. The Census Bureau upwardly revised December's estimate from $681.2 billion to $684.5 billion, though they downgraded November's figure from $683.7 to $680.5 million. Private nonresidential construction spending increased by 1% for the month, while its public counterpart expanded by 4.6%.
"After several months of relatively weak nonresidential construction spending data, today's data release was most welcome," ABC Chief Economist Anirban Basu said. "While January is a difficult month to interpret and one that should not be overly emphasized, the fact of the matter is that the year-over-year performance in spending is consistent with a host of industry indicators. For many months, the average contractor has been reporting decent backlog. Measures of industry confidence have remained stable even in the face of adverse news coming from various parts of the world.
"While the nonresidential construction spending recovery appears to remain in place, the industry's overall outlook remains murky," Basu said. "The global economy remains weak, and domestic corporate profitability has been slipping. The U.S. economic recovery continues to be under-diversified, with consumers continuing to lead the way. If corporate profitability continues to struggle, given falling exports and a general lack of confidence among CEOs, the pace of employment growth will slow over the course of 2016. That will presumably affect consumer spending, which is already being hampered by rising health care costs. That, in turn, could jeopardize the ongoing economic recovery, now on its way to completing its seventh year."
Spending increased in January on a monthly basis in 10 of 16 nonresidential construction sectors:
- Spending in the highway and street category expanded 14.6% from December 2015 and is 33.9 higher than in January 2015.
- Sewage and waste disposal-related spending expanded 4% for the month and 1.4% from the same time last year.
- Spending in the amusement and recreation category climbed 0.7% on a monthly basis and 16.9% on a year-over-year basis.
- Conservation and development-related spending is 10% higher on a monthly basis and 1.6% higher on a yearly basis.
- Lodging-related spending is up 6.3% for the month and is up 34.8% on a year-ago basis.
- Spending in the religious category grew 4.2% for the month and 0.2% from January 2015.
- Manufacturing-related spending expanded 4.2% on a monthly basis and is up 11.3% on a yearly basis.
- Spending in the power category expanded 2.9% from December 2015 and is 8.1% higher than in January 2015.
- Water supply-related spending expanded 2% on a monthly basis but fell 7.9% on a yearly basis.
- Spending in the office category grew 0.2% from December 2015 and is up 19.6% from January 2015.
Spending in six of the nonresidential construction subsectors fell in January on a monthly basis:
- Commercial-related construction spending fell 4.3% for the month but grew 0.8% on a year-over-year basis.
- Educational-related construction spending fell 1.1% on a monthly basis, but expanded 12.1% on a yearly basis.
- Transportation-related spending fell 2.5% month-over-month, but expanded 0.6% year-over-year.
- Health care-related spending fell 0.1% month-over-month but is up 1.8% year-over-year.
- Public safety-related spending is down 1.5% for the month and 3.2% from the same time one year ago.
- Communication-related spending fell by 4.2% month-over-month but expanded 27.2% year-over-year.
Related Stories

Market Data | Jun 3, 2019
4.1% annual growth in office asking rents above five-year compound annual growth rate
Market has experienced no change in office vacancy rates in three quarters.

Market Data | May 30, 2019
Construction employment increases in 250 out of 358 metros from April 2018 to April 2019
Demand for work is outpacing the supply of workers.

Market Data | May 24, 2019
Construction contractors confidence remains high in March
More than 70% of contractors expect to increase staffing levels over the next six months.

Market Data | May 22, 2019
Slight rebound for architecture billings in April
AIA’s ABI score for April showed a small increase in design services at 50.5 in April.

Market Data | May 9, 2019
The U.S. hotel construction pipeline continues to grow in the first quarter as the economy shows surprising strength
Projects currently under construction stand at 1,709 projects/227,924 rooms.

Market Data | May 9, 2019
Construction input prices continue to rise
Nonresidential input prices rose 0.9% compared to March and are up 2.8% on an annual basis.

Market Data | May 7, 2019
Construction costs in major metros continued to climb last year
Latest Rider Levett Bucknall report estimates rise at more than double the rate of 2018 Growth Domestic Product.

Market Data | Apr 29, 2019
U.S. economic growth crosses 3% threshold to begin the year
Growth was fueled by myriad factors, including personal consumption expenditures, private inventory investment, surprisingly rapid growth in exports, state and local government spending and intellectual property.

Market Data | Apr 18, 2019
ABC report: 'Confidence seems to be making a comeback in America'
The Construction Confidence Index remained strong in February, according to the Associated Builders and Contractors.

Market Data | Apr 16, 2019
ABC’s Construction Backlog Indicator rebounds in February
ABC's Construction Backlog Indicator expanded to 8.8 months in February 2019.


