


In 2009, we met with Senior Facility Managers of four U.S. national laboratories to discuss a major limitation in the way they summarized their capital needs. As with most large organizations, they expressed capital needs in terms of deferred maintenance projects—things that needed to be fixed as determined by condition assessment (inspection or prescribed schedule). To put these needs in perspective, they computed a facility condition index (FCI), which is the ratio of deferred maintenance (D.M) costs to the replacement value of a building or portfolio.
Several years later, following the acquisition of Whitestone Research by CBRE Inc., it quickly became clear that major healthcare organizations around the world oftentimes employ a similar FCI based approach to their capital planning and prioritization decisions.
FACILITY CONDITION INDEX BREAKDOWN
According to a well-known scale developed initially for educational facilities in 1991, a facility is considered in poor condition if its FCI exceeds 90%. The shortcomings of the FCI approach are well-known, as results are not easily compared with alternative condition assessment approaches, and it does not contemplate methodologies for determining replacement values. These choices can become highly political for an organization that uses, as many do, the FCI as a key policy metric.
The basic concern of the laboratory facility managers was that the FCI did not represent the true condition of the facility in terms of safety, security, mission relevance, and other criteria that actually guide their decisions. FCI is also not a forecast or leading indicator that demonstrates consequences of alternative actions. These concerns led to a series of small projects that would eventually define a new approach to summarizing facility condition and prioritizing capital expenditures.
The new method, Risk Scanning, meets three requirements identified in our original meeting. The process must not rely on expensive inspections, must incorporate multiple (customizable) criteria, and the outcomes must be expressed as a simple monetary value.
This approach has universal applicability for laboratories and for large, corporate occupiers. In addition, we have found this approach to be particularly relevant for healthcare organizations today, given the extraordinary economic and regulatory pressures that have become a reality for the industry.
RISK SCANNING
Risk Scanning assumes that buildings or other assets can be reduced to an inventory of components (roof, HVAC equipment, plumbing fixtures, etc.). Each component has a “survivor” curve that relates its age to the likelihood of its failure in the future, little different than an actuarial calculation for an insurance policy. And each component, should it fail, could have consequences for the building operation. Below, Figure 1 illustrates how this data could be used as a simple sort by probability of failure, consequence of failure, or replacement cost.
Figure 1
A more useful view of this data combines knowledge of the probability of failure and the potential consequences as the Risk Facility Managers implicitly consider when scheduling repairs. For example, a new light bulb in a closet would be low risk (low likelihood of failure, low impact on safety, security, mission, etc.), while a roof or electrical panel, far beyond their expected service life would be a high risk. Individual component risk ratings can be aggregated into risk maps by building, consequence type, or aggregated at the portfolio level.
Another example is a risk scan of a data center built in 1980, as shown in Figure 2. Risk is summarized by three consequences or threats of failure – mission, productivity and safety. The “Loss Intensity” is the measure (low, medium, high) of the impact of failure. Each cell in the tables is the sum of the replacement value of each component. For instance, in the first table there are high risk (red) components with replacement values totaling $374,210.
Figure 2: Dashboard showing risk by consequence
One way to represent overall risk is to sum across the individual tables in Figure 2, by risk category (red = high, yellow = moderate, green = low) to produce a single risk column, as shown in Figure 3. This shows that the costs to replace components rated high risk in 2015 for any reason (mission, productivity, or safety) were $2,349,315. Note that some components are high risk for multiple reasons.
Figure 3: Risk Column
The calculation of the column can be modified for different purposes. The ratings from the dashboard could be weighted to reflect management priorities. The likelihood of failure, and consequent migration of risk ratings, could be estimated for a range of years, as shown for the period 2015-2019.
COMPARING THE FCI WITH RISK SCANNING
The data center example provides a useful comparison of the output from a simple condition assessment with the additional data provided by Risk Scanning.
A conventional facility condition assessment using a life cycle cost model indicated that 75 components had exceeded their service life. The costs of replacing these would be $4,771,159. Considering this amount to be deferred maintenance (D.M.), the FCI would be 5% (given $100 million replacement value). This would be summarized as a building in “fair” condition.
Figure 4
A Risk Scan of the component inventory indicates that 13 components are at high risk, and the costs of replacing these would be $2,349,315. This is less than half the costs of replacements by a simple service life-assessment. An FCI based on high risk components would be 2.2%, indicating a building in “good” condition.
In this case, with the additional information provided by Risk Scanning, the facility would be considered in better condition than with the simple condition assessment. Moreover, the risk scan would provide a rating for all components—including those not yet considered as deferred maintenance—as a basis for anticipating future needs and prioritization.
CONCLUSION
The Risk Scanning approach uses well-known risk analytics applied to pre-existing facility data to provide a richer view of facility condition more consistent with actual management decision making. In practice, limited funding is directed to those repairs and replacements that address corporate priorities, such as safety, security, and mission achievement. For healthcare systems, this approach can provide critical insight for decision-making about capital deployment where actionable criteria are not established or where data is limited.
About the Authors
Peter Lufkin is Senior Managing Director and Luca Romani is Senior Analyst with CBRE Whitestone.
Related Stories
| Apr 19, 2011
What are the 15 most-watched construction and engineering stocks?
According to Motley Fool, a multimedia financial services company, the most-watched construction and engineering stock is Fluor (NYSE: FLR), which ranks #1 on BD+C’s Giants 300 engineering list with $1.994 billion in revenue in 2009. Check out the 14 other most-watched A/E stocks.

| Apr 19, 2011
AIA announces top 10 green Projects for 2011
The American Institute of Architects Committee on the Environment announced its Top 10 Green Projects for 2011. Among the winners: Cherokee Studios in Los Angeles, the Department of Energy's National Renewable Energy Laboratory in Golden, Colo., and the Vancouver Convention Centre West in Vancouver, British Columbia.

| Apr 18, 2011
Greening and Upgrading Today’s Vertical Transport Systems
Earn 1.0 AIA/CES HSW/SD learning units by studying this article and passing the online exam.

| Apr 14, 2011
U.S. embassies on a mission to green the world's buildings
The U.S. is putting greater emphasis on greening its worldwide portfolio of embassies. The U.S. State Department-affiliated League of Green Embassies already has 70 U.S. embassies undergoing efforts to reduce their environmental impact, and the organization plans to increase that number to more than 100 by the end of the year.

| Apr 14, 2011
How AEC Professionals Choose Windows and Doors
Window and door systems need to perform. Respondents to our annual window and door survey overwhelmingly reported that performance, weather resistance, durability, and quality were key reasons a particular window or door was specified.
| Apr 14, 2011
USGBC debuts LEED for Healthcare
The U.S. Green Building Council (USGBC) introduces its latest green building rating system, LEED for Healthcare. The rating system guides the design and construction of both new buildings and major renovations of existing buildings, and can be applied to inpatient, outpatient and licensed long-term care facilities, medical offices, assisted living facilities and medical education and research centers.
| Apr 13, 2011
National Roofing Contractors Association revises R-value of polyisocyanurate (ISO) insulation
NRCA has updated their R-value recommendation for polyisocyanurate roof insulation with the publication of the 2011 The NRCA Roofing Manual: Membrane Roof Systems.

| Apr 13, 2011
Professor Edward Glaeser, PhD, on how cities are mankind’s greatest invention
Edward Glaeser, PhD, the Fred and Eleanor Glimp Professor of Economics at Harvard University and director of the Taubman Center for State and Local Government and the Rappaport Institute for Greater Boston, as well as the author of Triumph of the City: How Our Greatest Invention Makes Us Richer, Smarter, Healthier, and Happier, on how cities are mankind’s greatest invention.
| Apr 13, 2011
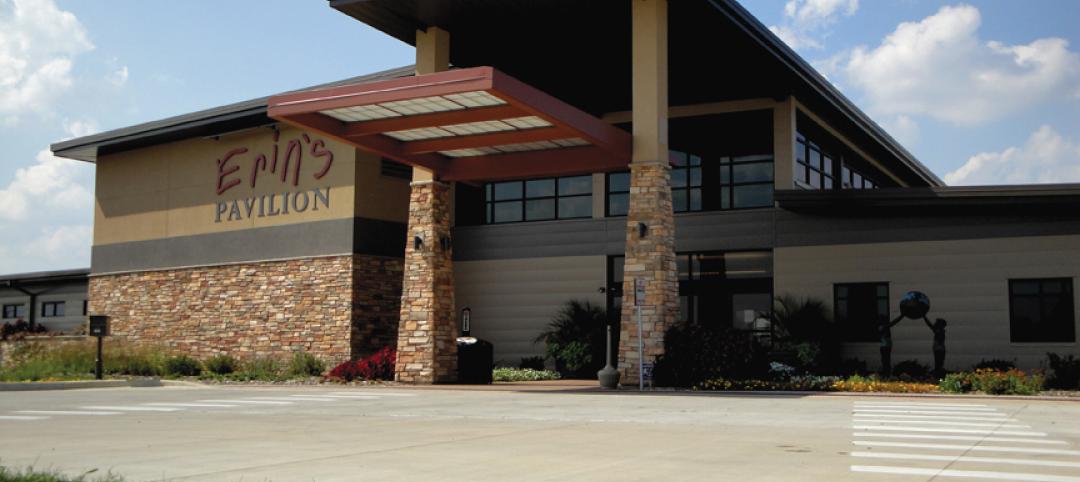
Southern Illinois park pavilion earns LEED Platinum
Erin’s Pavilion, a welcome and visitors center at the 80-acre Edwin Watts Southwind Park in Springfield, Ill., earned LEED Platinum. The new 16,000-sf facility, a joint project between local firm Walton and Associates Architects and the sustainability consulting firm Vertegy, based in St. Louis, serves as a community center and special needs education center, and is named for Erin Elzea, who struggled with disabilities during her life.

| Apr 13, 2011
Virginia hospital’s prescription for green construction: LEED Gold
Rockingham Memorial Hospital in Harrisonburg, Va., is the commonwealth’s first inpatient healthcare facility to earn LEED Gold. The 630,000-sf facility was designed by Earl Swensson Associates, with commissioning consultant SSRCx, both of Nashville.


