


In 2009, we met with Senior Facility Managers of four U.S. national laboratories to discuss a major limitation in the way they summarized their capital needs. As with most large organizations, they expressed capital needs in terms of deferred maintenance projects—things that needed to be fixed as determined by condition assessment (inspection or prescribed schedule). To put these needs in perspective, they computed a facility condition index (FCI), which is the ratio of deferred maintenance (D.M) costs to the replacement value of a building or portfolio.
Several years later, following the acquisition of Whitestone Research by CBRE Inc., it quickly became clear that major healthcare organizations around the world oftentimes employ a similar FCI based approach to their capital planning and prioritization decisions.
FACILITY CONDITION INDEX BREAKDOWN
According to a well-known scale developed initially for educational facilities in 1991, a facility is considered in poor condition if its FCI exceeds 90%. The shortcomings of the FCI approach are well-known, as results are not easily compared with alternative condition assessment approaches, and it does not contemplate methodologies for determining replacement values. These choices can become highly political for an organization that uses, as many do, the FCI as a key policy metric.
The basic concern of the laboratory facility managers was that the FCI did not represent the true condition of the facility in terms of safety, security, mission relevance, and other criteria that actually guide their decisions. FCI is also not a forecast or leading indicator that demonstrates consequences of alternative actions. These concerns led to a series of small projects that would eventually define a new approach to summarizing facility condition and prioritizing capital expenditures.
The new method, Risk Scanning, meets three requirements identified in our original meeting. The process must not rely on expensive inspections, must incorporate multiple (customizable) criteria, and the outcomes must be expressed as a simple monetary value.
This approach has universal applicability for laboratories and for large, corporate occupiers. In addition, we have found this approach to be particularly relevant for healthcare organizations today, given the extraordinary economic and regulatory pressures that have become a reality for the industry.
RISK SCANNING
Risk Scanning assumes that buildings or other assets can be reduced to an inventory of components (roof, HVAC equipment, plumbing fixtures, etc.). Each component has a “survivor” curve that relates its age to the likelihood of its failure in the future, little different than an actuarial calculation for an insurance policy. And each component, should it fail, could have consequences for the building operation. Below, Figure 1 illustrates how this data could be used as a simple sort by probability of failure, consequence of failure, or replacement cost.
Figure 1
A more useful view of this data combines knowledge of the probability of failure and the potential consequences as the Risk Facility Managers implicitly consider when scheduling repairs. For example, a new light bulb in a closet would be low risk (low likelihood of failure, low impact on safety, security, mission, etc.), while a roof or electrical panel, far beyond their expected service life would be a high risk. Individual component risk ratings can be aggregated into risk maps by building, consequence type, or aggregated at the portfolio level.
Another example is a risk scan of a data center built in 1980, as shown in Figure 2. Risk is summarized by three consequences or threats of failure – mission, productivity and safety. The “Loss Intensity” is the measure (low, medium, high) of the impact of failure. Each cell in the tables is the sum of the replacement value of each component. For instance, in the first table there are high risk (red) components with replacement values totaling $374,210.
Figure 2: Dashboard showing risk by consequence
One way to represent overall risk is to sum across the individual tables in Figure 2, by risk category (red = high, yellow = moderate, green = low) to produce a single risk column, as shown in Figure 3. This shows that the costs to replace components rated high risk in 2015 for any reason (mission, productivity, or safety) were $2,349,315. Note that some components are high risk for multiple reasons.
Figure 3: Risk Column
The calculation of the column can be modified for different purposes. The ratings from the dashboard could be weighted to reflect management priorities. The likelihood of failure, and consequent migration of risk ratings, could be estimated for a range of years, as shown for the period 2015-2019.
COMPARING THE FCI WITH RISK SCANNING
The data center example provides a useful comparison of the output from a simple condition assessment with the additional data provided by Risk Scanning.
A conventional facility condition assessment using a life cycle cost model indicated that 75 components had exceeded their service life. The costs of replacing these would be $4,771,159. Considering this amount to be deferred maintenance (D.M.), the FCI would be 5% (given $100 million replacement value). This would be summarized as a building in “fair” condition.
Figure 4
A Risk Scan of the component inventory indicates that 13 components are at high risk, and the costs of replacing these would be $2,349,315. This is less than half the costs of replacements by a simple service life-assessment. An FCI based on high risk components would be 2.2%, indicating a building in “good” condition.
In this case, with the additional information provided by Risk Scanning, the facility would be considered in better condition than with the simple condition assessment. Moreover, the risk scan would provide a rating for all components—including those not yet considered as deferred maintenance—as a basis for anticipating future needs and prioritization.
CONCLUSION
The Risk Scanning approach uses well-known risk analytics applied to pre-existing facility data to provide a richer view of facility condition more consistent with actual management decision making. In practice, limited funding is directed to those repairs and replacements that address corporate priorities, such as safety, security, and mission achievement. For healthcare systems, this approach can provide critical insight for decision-making about capital deployment where actionable criteria are not established or where data is limited.
About the Authors
Peter Lufkin is Senior Managing Director and Luca Romani is Senior Analyst with CBRE Whitestone.
Related Stories
| May 18, 2011
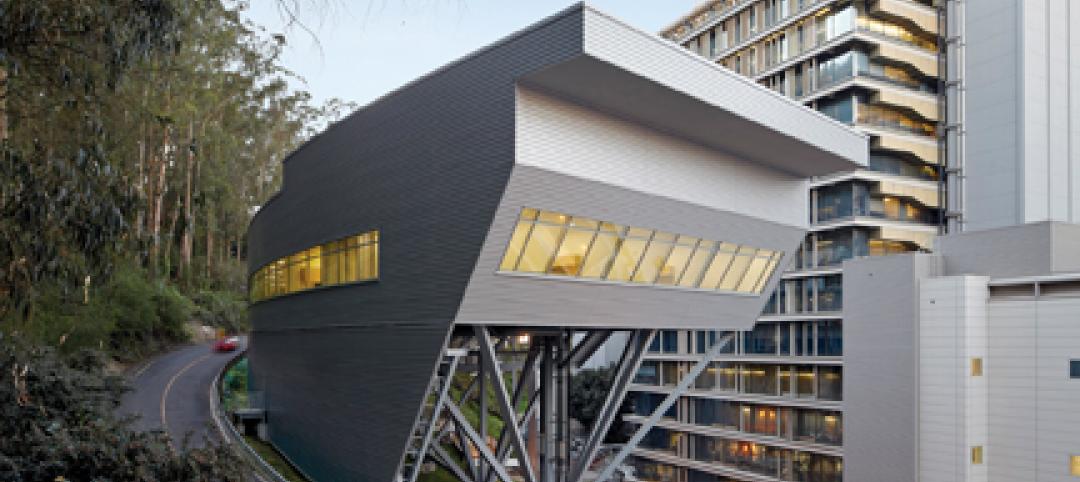
Raphael Viñoly’s serpentine-shaped building snakes up San Francisco hillside
The hillside location for the Ray and Dagmar Dolby Regeneration Medicine building at the University of California, San Francisco, presented a challenge to the Building Team of Raphael Viñoly, SmithGroup, DPR Construction, and Forell/Elsesser Engineers. The 660-foot-long serpentine-shaped building sits on a structural framework 40 to 70 feet off the ground to accommodate the hillside’s steep 60-degree slope.

| May 18, 2011
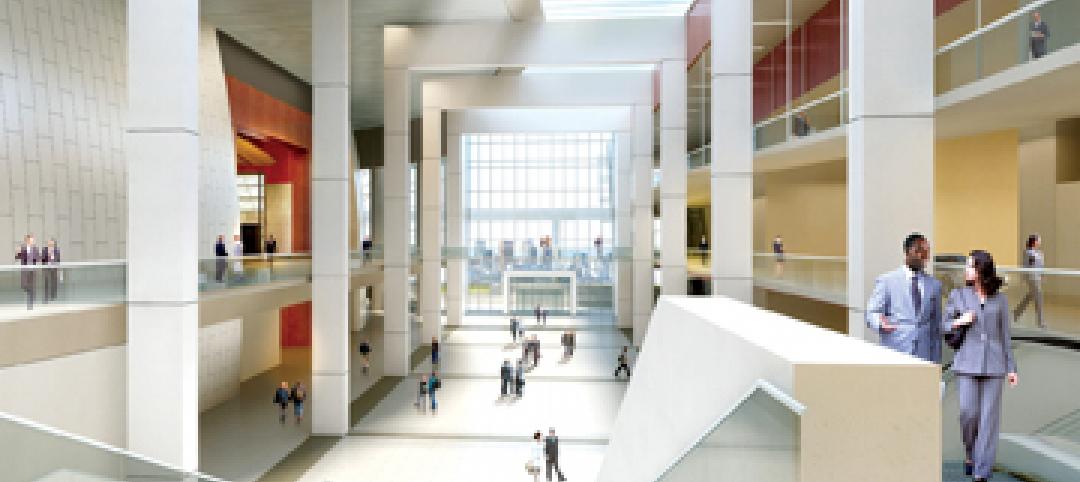
New center provides home to medical specialties
Construction has begun on the 150,000-sf Medical Arts Pavilion at the University Medical Center in Princeton, N.J.

| May 18, 2011
Improvements add to Detroit convention center’s appeal
Interior and exterior renovations and updates will make the Detroit Cobo Center more appealing to conventioneers. A new 40,000-sf ballroom will take advantage of the center’s riverfront location, with views of the river and downtown.

| May 18, 2011
One of Delaware’s largest high schools seeks LEED for Schools designation
The $82 million, 280,000-sf Dover (Del.) High School will have capacity for 1,800 students and feature a 900-seat theater, a 2,500-seat gymnasium, and a 5,000-seat football stadium.
| May 18, 2011
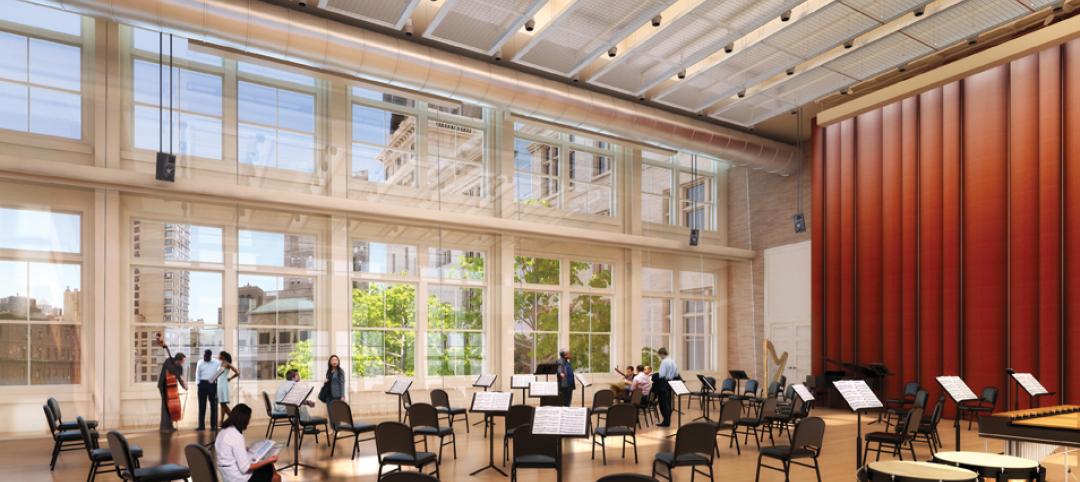
Carnegie Hall vaults into the 21st century with a $200 million renovation
Historic Carnegie Hall in New York City is in the midst of a major $200 million renovation that will bring the building up to contemporary standards, increase educational and backstage space, and target LEED Silver.
| May 17, 2011
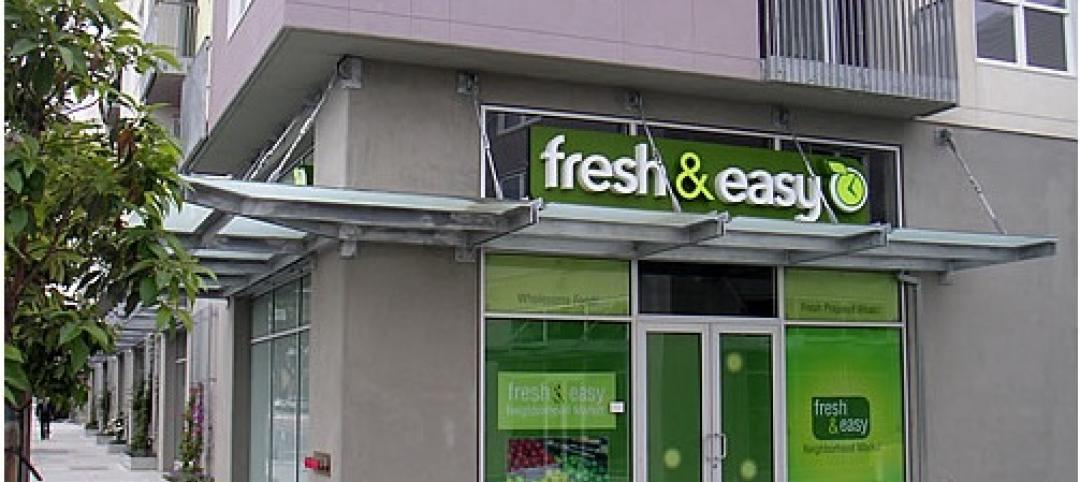
Redesigning, redefining the grocery shopping experience
The traditional 40,000- to 60,000-sf grocery store is disappearing and much of the change is happening in the city. Urban infill sites and mixed-use projects offer grocers a rare opportunity to repackage themselves into smaller, more efficient, and more convenient retail outlets. And the AEC community will have a hand in developing how these facilities will look and operate.
| May 17, 2011
Architecture billings index fell in April, hurt by tight financing for projects
The architecture billings index, a leading indicator of U.S. construction activity, fell in April, hurt by tight financing for projects. The architecture billings index fell 2.9 points last month to 47.6, a level that indicates declining demand for architecture services, according to the American Institute of Architects.

| May 17, 2011
Sustainability tops the syllabus at net-zero energy school in Texas
Texas-based firm Corgan designed the 152,200-sf Lady Bird Johnson Middle School in Irving, Texas, with the goal of creating the largest net-zero educational facility in the nation, and the first in the state. The facility is expected to use 50% less energy than a standard school.


