


In 2009, we met with Senior Facility Managers of four U.S. national laboratories to discuss a major limitation in the way they summarized their capital needs. As with most large organizations, they expressed capital needs in terms of deferred maintenance projects—things that needed to be fixed as determined by condition assessment (inspection or prescribed schedule). To put these needs in perspective, they computed a facility condition index (FCI), which is the ratio of deferred maintenance (D.M) costs to the replacement value of a building or portfolio.
Several years later, following the acquisition of Whitestone Research by CBRE Inc., it quickly became clear that major healthcare organizations around the world oftentimes employ a similar FCI based approach to their capital planning and prioritization decisions.
FACILITY CONDITION INDEX BREAKDOWN
According to a well-known scale developed initially for educational facilities in 1991, a facility is considered in poor condition if its FCI exceeds 90%. The shortcomings of the FCI approach are well-known, as results are not easily compared with alternative condition assessment approaches, and it does not contemplate methodologies for determining replacement values. These choices can become highly political for an organization that uses, as many do, the FCI as a key policy metric.
The basic concern of the laboratory facility managers was that the FCI did not represent the true condition of the facility in terms of safety, security, mission relevance, and other criteria that actually guide their decisions. FCI is also not a forecast or leading indicator that demonstrates consequences of alternative actions. These concerns led to a series of small projects that would eventually define a new approach to summarizing facility condition and prioritizing capital expenditures.
The new method, Risk Scanning, meets three requirements identified in our original meeting. The process must not rely on expensive inspections, must incorporate multiple (customizable) criteria, and the outcomes must be expressed as a simple monetary value.
This approach has universal applicability for laboratories and for large, corporate occupiers. In addition, we have found this approach to be particularly relevant for healthcare organizations today, given the extraordinary economic and regulatory pressures that have become a reality for the industry.
RISK SCANNING
Risk Scanning assumes that buildings or other assets can be reduced to an inventory of components (roof, HVAC equipment, plumbing fixtures, etc.). Each component has a “survivor” curve that relates its age to the likelihood of its failure in the future, little different than an actuarial calculation for an insurance policy. And each component, should it fail, could have consequences for the building operation. Below, Figure 1 illustrates how this data could be used as a simple sort by probability of failure, consequence of failure, or replacement cost.
Figure 1
A more useful view of this data combines knowledge of the probability of failure and the potential consequences as the Risk Facility Managers implicitly consider when scheduling repairs. For example, a new light bulb in a closet would be low risk (low likelihood of failure, low impact on safety, security, mission, etc.), while a roof or electrical panel, far beyond their expected service life would be a high risk. Individual component risk ratings can be aggregated into risk maps by building, consequence type, or aggregated at the portfolio level.
Another example is a risk scan of a data center built in 1980, as shown in Figure 2. Risk is summarized by three consequences or threats of failure – mission, productivity and safety. The “Loss Intensity” is the measure (low, medium, high) of the impact of failure. Each cell in the tables is the sum of the replacement value of each component. For instance, in the first table there are high risk (red) components with replacement values totaling $374,210.
Figure 2: Dashboard showing risk by consequence
One way to represent overall risk is to sum across the individual tables in Figure 2, by risk category (red = high, yellow = moderate, green = low) to produce a single risk column, as shown in Figure 3. This shows that the costs to replace components rated high risk in 2015 for any reason (mission, productivity, or safety) were $2,349,315. Note that some components are high risk for multiple reasons.
Figure 3: Risk Column
The calculation of the column can be modified for different purposes. The ratings from the dashboard could be weighted to reflect management priorities. The likelihood of failure, and consequent migration of risk ratings, could be estimated for a range of years, as shown for the period 2015-2019.
COMPARING THE FCI WITH RISK SCANNING
The data center example provides a useful comparison of the output from a simple condition assessment with the additional data provided by Risk Scanning.
A conventional facility condition assessment using a life cycle cost model indicated that 75 components had exceeded their service life. The costs of replacing these would be $4,771,159. Considering this amount to be deferred maintenance (D.M.), the FCI would be 5% (given $100 million replacement value). This would be summarized as a building in “fair” condition.
Figure 4
A Risk Scan of the component inventory indicates that 13 components are at high risk, and the costs of replacing these would be $2,349,315. This is less than half the costs of replacements by a simple service life-assessment. An FCI based on high risk components would be 2.2%, indicating a building in “good” condition.
In this case, with the additional information provided by Risk Scanning, the facility would be considered in better condition than with the simple condition assessment. Moreover, the risk scan would provide a rating for all components—including those not yet considered as deferred maintenance—as a basis for anticipating future needs and prioritization.
CONCLUSION
The Risk Scanning approach uses well-known risk analytics applied to pre-existing facility data to provide a richer view of facility condition more consistent with actual management decision making. In practice, limited funding is directed to those repairs and replacements that address corporate priorities, such as safety, security, and mission achievement. For healthcare systems, this approach can provide critical insight for decision-making about capital deployment where actionable criteria are not established or where data is limited.
About the Authors
Peter Lufkin is Senior Managing Director and Luca Romani is Senior Analyst with CBRE Whitestone.
Related Stories
| Mar 29, 2011
City's design, transit system can ease gas costs
Some cities in the U.S. are better positioned to deal with rising gas prices than others because of their design and transit systems, according to CEOs for Cities, a Chicago-based nonprofit that works to build stronger cities. The key factor: whether residents have to drive everywhere, or have other options.

| Mar 29, 2011
Chicago’s Willis Tower to become a vertical solar farm
Chicago’s iconic Willis Tower (formerly the Sears Tower) is set to become a massive solar electric plant with the installation of a pilot solar electric glass project.

| Mar 29, 2011
Read up on Amazon.com's new green HQ
Phase IV of Amazon’s new headquarters in Seattle is nearly complete. The company has built 10 of the 11 buildings planned for its new campus in the South Lake Union neighborhood, and is on-track for a 2013 grand opening.

| Mar 29, 2011
Portuguese architect Eduardo Souto de Moura wins Pritzker Architecture Prize
Portugese architect Eduardo Souto de Moura, whose precisely-honed buildings reflect the influence of the late Chicago modernist Mies van der Rohe, is the 2011 winner of the Pritzker Architecture Prize, the field's highest honor.

| Mar 25, 2011
Qatar World Cup may feature carbon-fiber ‘clouds’
Engineers at Qatar University’s Department of Mechanical and Industrial Engineering are busy developing what they believe could act as artificial “clouds,” man-made saucer-type structures suspended over a given soccer stadium, working to shield tens of thousands of spectators from suffocating summer temperatures that regularly top 115 degrees Fahrenheit.

| Mar 23, 2011
AIA adds 13 new contract documents to Documents-on-Demand service
Web-based solution adds 13 popular Architect’s Scope of Services Documents to AIA Documents-on-Demand, providing easy access to documents anytime, anywhere.

| Mar 23, 2011
After 60 years of student lobbying, new activity center opens at University of Texas
The new Student Activity Center at the University of Texas campus, Austin, is the result of almost 60 years of students lobbying for another dedicated social and cultural center on campus. The 149,000-sf facility is designed to serve as the "campus living room," and should earn a LEED Gold certification, a first for the campus.
| Mar 23, 2011
Architecture Billings Index shows nominal increase
The American Institute of Architects (AIA) reported the February Architecture Billings Index score was 50.6, up slightly from a reading of 50.0 the previous month. This score reflects a modest increase in demand for design services (any score above 50 indicates an increase in billings). The new projects inquiry index was 56.4, compared to a mark of 56.5 in December.
| Mar 22, 2011
The American National Standards Institute accredits Stantec for greenhouse gas verification
Stantec Consulting Ltd.’s Atmospheric Environment Group has been awarded accreditation by the American National Standards Institute (ANSI) for verification of assertions related to greenhouse gas (GHG) emissions. The Scope of Accreditation is for verification of emissions and removals at the organizational level for Group 1 – General.
| Mar 22, 2011
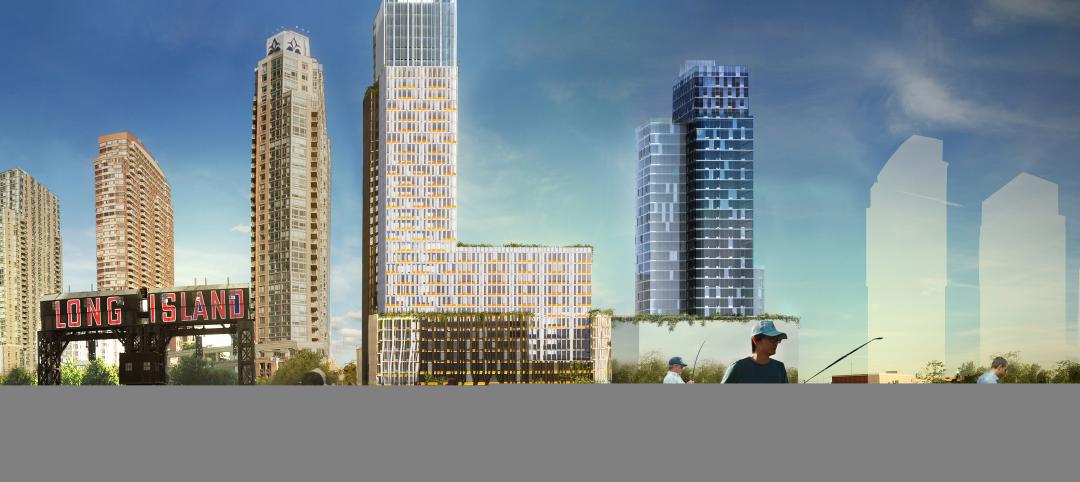
Mayor Bloomberg unveils plans for New York City’s largest new affordable housing complex since the ’70s
Plans for Hunter’s Point South, the largest new affordable housing complex to be built in New York City since the 1970s, include new residences for 5,000 families, with more than 900 in this first phase. A development team consisting of Phipps Houses, Related Companies, and Monadnock Construction has been selected to build the residential portion of the first phase of the Queens waterfront complex, which includes two mixed-use buildings comprising more than 900 housing units and roughly 20,000 square feet of new retail space.


