


Nonresidential construction spending bounced back in October, expanding 1 percent on a monthly basis and 4.3 percent year over year, according to a Dec. 2 release from the U.S. Census Bureau. Spending for the month totaled $611.8 billion on a seasonally adjusted, annualized basis. Additionally, the government revised the September spending figure up to $605.8 billion from $596.1 billion.
"This month's increase in nonresidential construction spending is far more consistent with the anecdotal information floating around the industry, which generally indicates that firms are becoming busier and that backlog is expanding," said Associated Builders and Contractors (ABC) Chief Economist Anirban Basu. "Although last month's numbers for nonresidential construction spending and employment were disappointing and could have implied the nation's nonresidential construction recovery is stalling, that is not the case.
"The outlook for 2015 remains upbeat," said Basu. "The economy has gained momentum over the past six to seven months and that is consistent with more aggressive construction starts and spending during the year to come. Even as the economy has gained momentum, the Federal Reserve has remained extraordinarily accommodative due in part to benign inflation readings. Low interest rates combined with solid economic momentum likely mean expansion for the nonresidential construction industry during the year ahead."
Eleven of the 16 nonresidential construction subsectors posted monthly increases in spending. Here's a recap:
• Office-related construction spending grew by 2 percent in October and is up 16.3 percent from the same time one year ago.
• Lodging construction spending is up 3.3 percent on a monthly basis and is up 15.9 percent on a year-over-year basis.
• Conservation and development-related construction spending grew 4.6 percent for the month and is up 33.1 percent on a yearly basis.
• Spending in the water supply category expanded 0.9 percent on a monthly basis, but is down 1.8 percent on a year-over-year basis.
• Amusement and recreation-related construction spending expanded 2.2 percent in October and is up 1.4 percent from the same time last year.
• Manufacturing-related spending expanded 3.4 percent on a monthly basis and is up 22.2 percent on an annual basis.
• Healthcare-related construction spending expanded 0.6 percent for the month but is down 8.4 percent from the same time last year.
• Education-related construction spending expanded 1.8 percent for the month and is up 3.6 percent on a year-over-year basis.
• Construction spending in the transportation category expanded 2.7 percent on a monthly basis and has expanded 1.6 percent on an annual basis.
• Highway and street-related construction spending expanded 1.2 percent in October and is up 0.1 percent compared to the same time last year.
• Public safety-related construction spending expanded 11.6 percent on a monthly basis but is down 1.2 percent on a year-over-year basis.
Monthly spending in five nonresidential construction subsectors declined in October. They are:
• Commercial construction spending fell 2.2 percent for the month but has grown 9.1 percent on a year-over-year basis.
• Communication construction spending declined 1.9 percent for the month and is down 9.4 percent for the year.
• Religious construction spending fell 3.7 percent for the month and is down 4.6 percent from the same time last year.
• Sewage and waste disposal-related construction spending declined 0.4 percent for the month and is down 0.2 percent on a 12-month basis.
• Power construction spending fell 1 percent for the month but is 0.7 percent higher than at the same time one year ago.
To view the previous spending report, click here.
Related Stories
Multifamily Housing | Aug 9, 2017
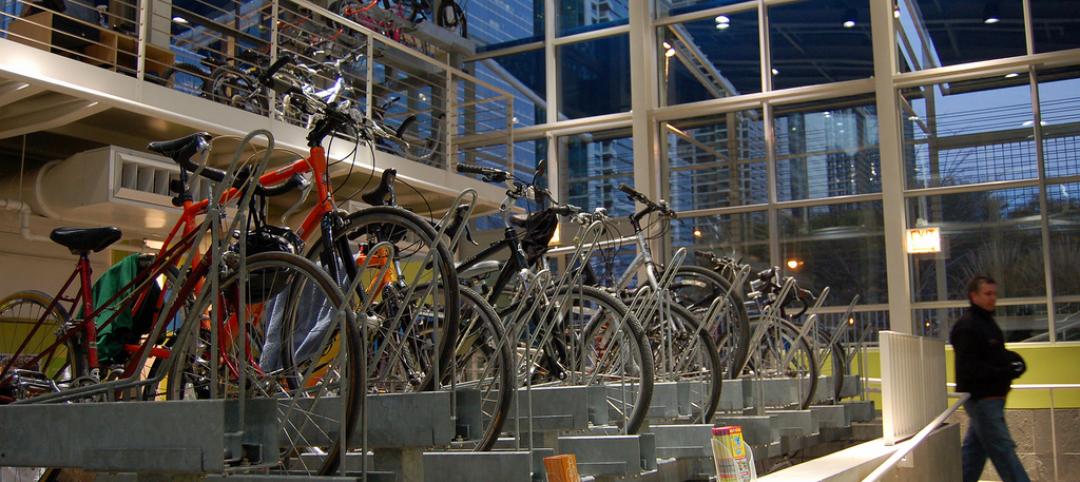
Multifamily developers, designers cater to occupants’ need for mobility
Bike storage facilities and “bicycle kitchens” are among the most popular mobility amenities in multifamily developments, according to a new survey by Multifamily Design + Construction magazine.
Giants 400 | Aug 9, 2017
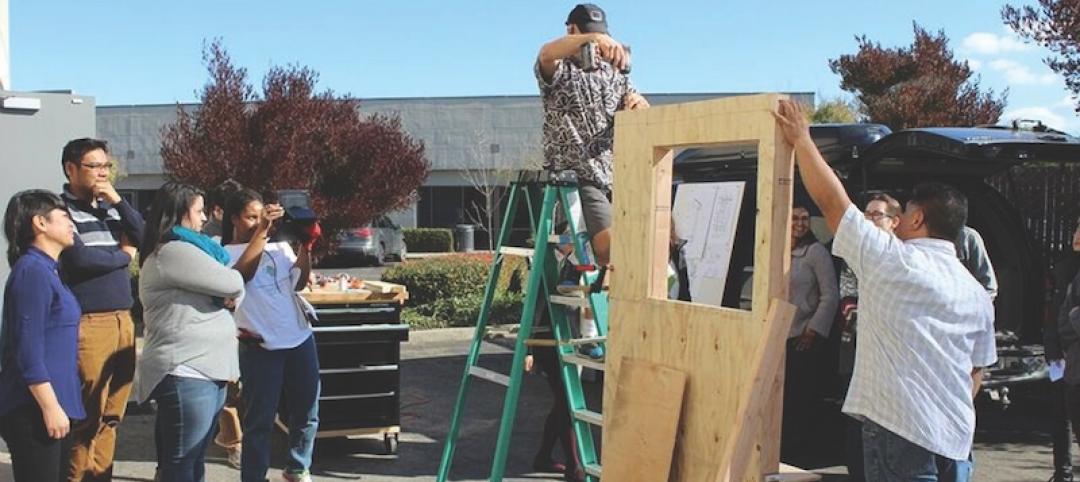
Innovation at 72 design firms
The following is a list of advancements architecture and A/E firms underwent in 2016, as reported in Building Design+Construction's 2017 Giants 300 Report.
Giants 400 | Aug 9, 2017
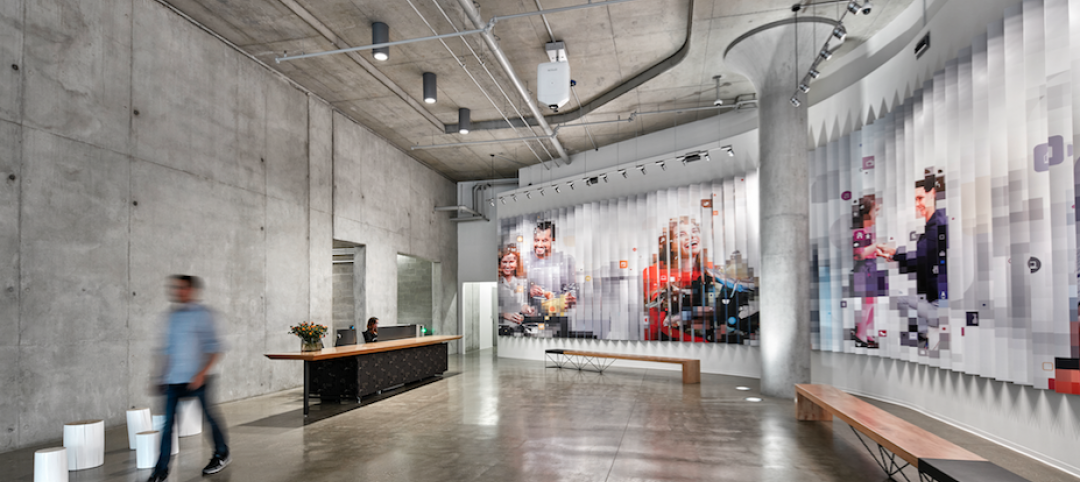
Top 115 Architecture Firms
Gensler, Perkins+Will, and HKS top Building Design+Construction’s ranking of the nation’s largest architecture firms, as reported in the 2017 Giants 300 Report.
Giants 400 | Aug 9, 2017
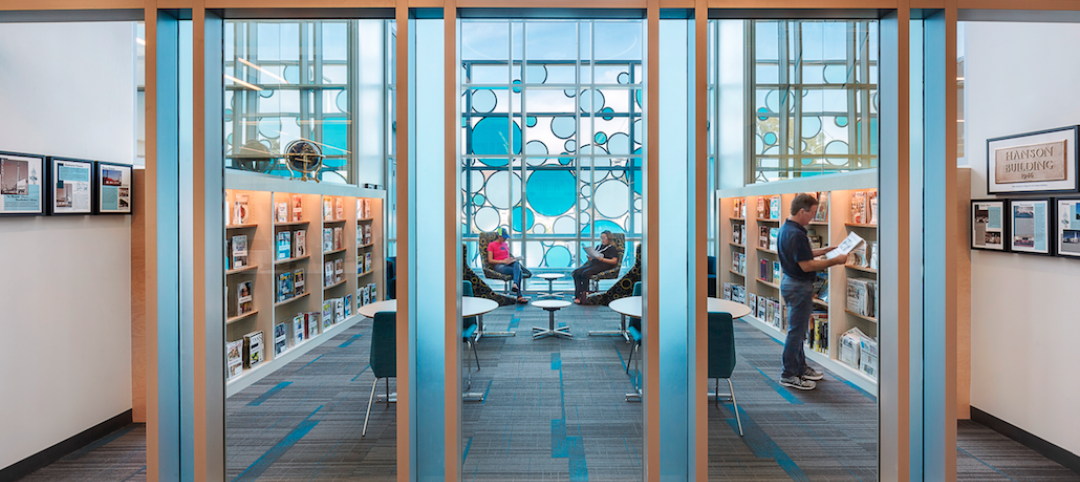
Top 100 Architecture/Engineering Firms
Stantec, HOK, and CallisonRTKL are among the nation’s largest architecture/engineering firms, according to Building Design+Construction’s 2017 Giants 300 Report.

Contractors | Aug 4, 2017
4 ways to prepare for a negotiation
Practice, practice, practice, and understanding both sides of the deliberation are critical to success in any negotiation.
Laboratories | Aug 3, 2017
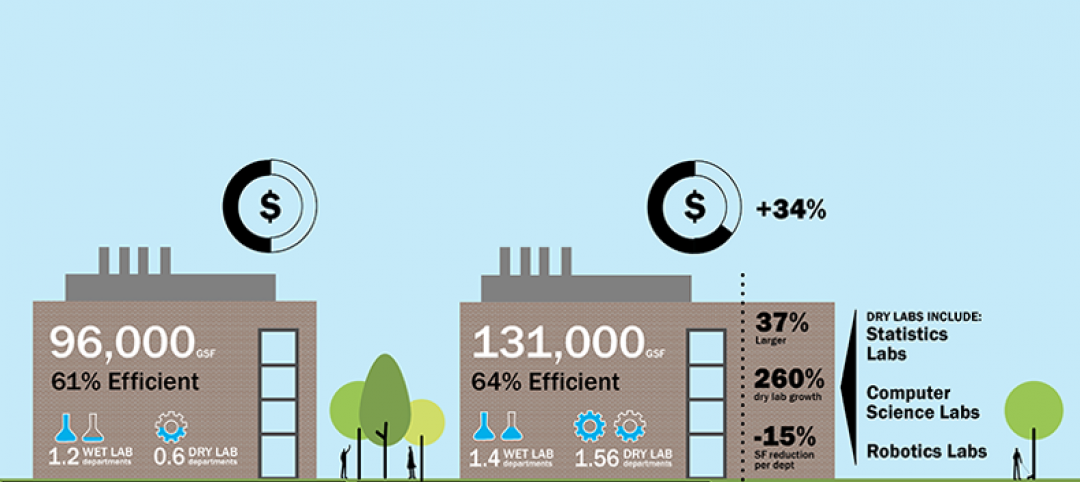
Today’s university lab building by the numbers
A three-month study of science facilities conducted by Shepley Bulfinch reveals key findings related to space allocation, size, and cost.
Lighting | Aug 2, 2017
Dynamic white lighting mimics daylighting
By varying an LED luminaire’s color temperature, it is possible to mimic daylighting, to some extent, and the natural circadian rhythms that accompany it, writes DLR Group’s Sean Avery.

Healthcare Facilities | Aug 2, 2017
8 healthcare design lessons from shadowing a nurse
From the surprising number of “hunting and gathering” trips to the need for quiet spaces for phone calls, interior designer Carolyn Fleetwood Blake shares her takeaways from a day shadowing a nurse.
Sponsored | Architects | Aug 2, 2017
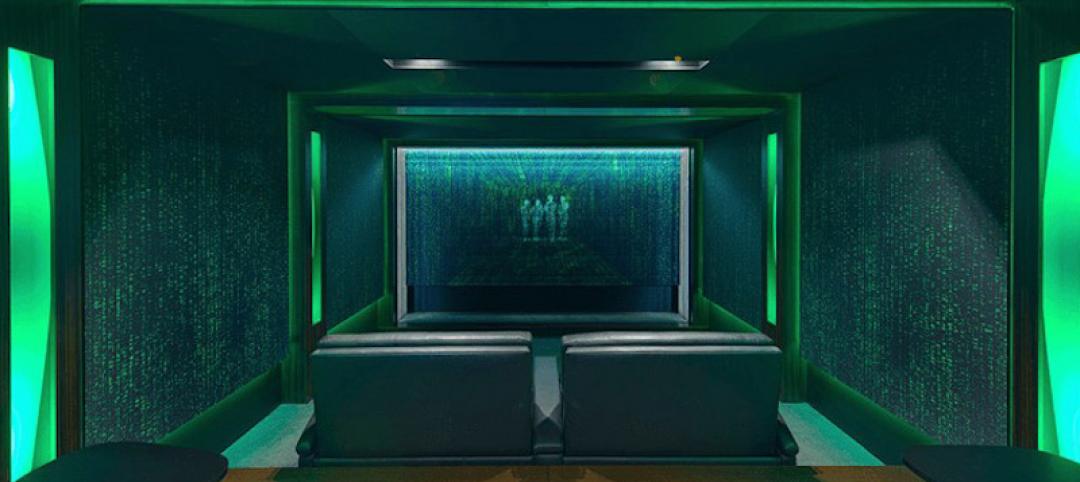
Are visual ergonomics the new key to project delivery?
An Australian Home Theater Company is out to prove that the easier you can see it, the easier you can sell it.

Multifamily Housing | Jul 27, 2017
Apartment market index: Business conditions soften, but still solid
Despite some softness at the high end of the apartment market, demand for apartments will continue to be substantial for years to come, according to the National Multifamily Housing Council.


