


Nonresidential construction spending bounced back in October, expanding 1 percent on a monthly basis and 4.3 percent year over year, according to a Dec. 2 release from the U.S. Census Bureau. Spending for the month totaled $611.8 billion on a seasonally adjusted, annualized basis. Additionally, the government revised the September spending figure up to $605.8 billion from $596.1 billion.
"This month's increase in nonresidential construction spending is far more consistent with the anecdotal information floating around the industry, which generally indicates that firms are becoming busier and that backlog is expanding," said Associated Builders and Contractors (ABC) Chief Economist Anirban Basu. "Although last month's numbers for nonresidential construction spending and employment were disappointing and could have implied the nation's nonresidential construction recovery is stalling, that is not the case.
"The outlook for 2015 remains upbeat," said Basu. "The economy has gained momentum over the past six to seven months and that is consistent with more aggressive construction starts and spending during the year to come. Even as the economy has gained momentum, the Federal Reserve has remained extraordinarily accommodative due in part to benign inflation readings. Low interest rates combined with solid economic momentum likely mean expansion for the nonresidential construction industry during the year ahead."
Eleven of the 16 nonresidential construction subsectors posted monthly increases in spending. Here's a recap:
• Office-related construction spending grew by 2 percent in October and is up 16.3 percent from the same time one year ago.
• Lodging construction spending is up 3.3 percent on a monthly basis and is up 15.9 percent on a year-over-year basis.
• Conservation and development-related construction spending grew 4.6 percent for the month and is up 33.1 percent on a yearly basis.
• Spending in the water supply category expanded 0.9 percent on a monthly basis, but is down 1.8 percent on a year-over-year basis.
• Amusement and recreation-related construction spending expanded 2.2 percent in October and is up 1.4 percent from the same time last year.
• Manufacturing-related spending expanded 3.4 percent on a monthly basis and is up 22.2 percent on an annual basis.
• Healthcare-related construction spending expanded 0.6 percent for the month but is down 8.4 percent from the same time last year.
• Education-related construction spending expanded 1.8 percent for the month and is up 3.6 percent on a year-over-year basis.
• Construction spending in the transportation category expanded 2.7 percent on a monthly basis and has expanded 1.6 percent on an annual basis.
• Highway and street-related construction spending expanded 1.2 percent in October and is up 0.1 percent compared to the same time last year.
• Public safety-related construction spending expanded 11.6 percent on a monthly basis but is down 1.2 percent on a year-over-year basis.
Monthly spending in five nonresidential construction subsectors declined in October. They are:
• Commercial construction spending fell 2.2 percent for the month but has grown 9.1 percent on a year-over-year basis.
• Communication construction spending declined 1.9 percent for the month and is down 9.4 percent for the year.
• Religious construction spending fell 3.7 percent for the month and is down 4.6 percent from the same time last year.
• Sewage and waste disposal-related construction spending declined 0.4 percent for the month and is down 0.2 percent on a 12-month basis.
• Power construction spending fell 1 percent for the month but is 0.7 percent higher than at the same time one year ago.
To view the previous spending report, click here.
Related Stories
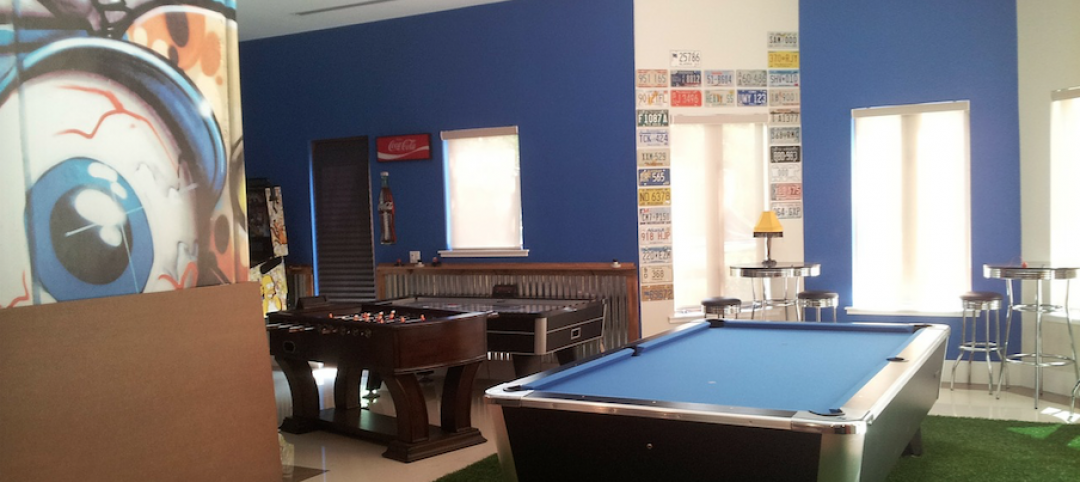
Multifamily Housing | Jul 27, 2017
Game rooms and game simulators popular amenities in multifamily developments
The number of developments providing space for physical therapy was somewhat surprising, according to a new survey.
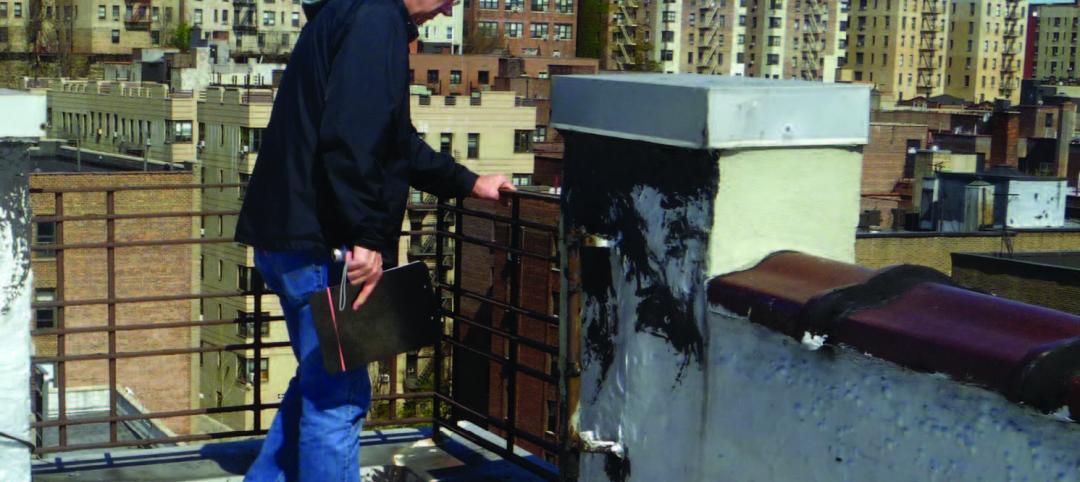
Building Enclosure Systems | Jul 26, 2017
Balcony and roof railings and the code: Maintain, repair, or replace? [AIA course]
Lacking familiarity with current requirements, some owners or managers complete a roof or balcony rehabilitation, only to learn after the fact that they need to tear noncompliant railings out of their new roof or terrace and install new ones.

Office Buildings | Jul 26, 2017
Meeting space leads to innovation
PDR Principal Larry Lander explains how to design for workplaces where four generations are working together.

Architects | Jul 25, 2017
AIA 2030 Commitment expands beyond 400 architecture firms
The 2016 Progress Report is now available.

Multifamily Housing | Jul 19, 2017
Student housing trends: The transformation of co-living in college
The Student Hotel is representative of a new model for delivering housing solutions for students globally.

Designers | Jul 19, 2017
5 laws every designer can live by
What is design? Who are designers? And are there any common laws or rules than can unite the many types of design that exist?

Sponsored | Architects | Jul 19, 2017
Introducing StrXur by Bluebeam
Our goal is to present unique perspectives you may not be able to find anywhere else.

Sponsored | Accelerate Live! | Jul 13, 2017
Defining the future by mastering the art of change
From my perspective, what separates organizations thriving in the digital revolution from those who are not boils down to one thing: leadership.

Multifamily Housing | Jul 12, 2017
Midyear Rent Report: 26 states saw rental price increases in first half of 2017
The most notable rental increases are in growing markets in the South and Southwest: New Orleans, Glendale, Ariz., Houston, Reno, N.V., and Atlanta.

Giants 400 | Jul 12, 2017
Innovation abounds, but will it lead to growth for AEC Giants?
Engineering firms such as Arup, Glumac, and Thornton Tomasetti are leveraging their in-house expertise to develop products and tools for their design teams, clients, and even the competition.


