


Nonresidential construction spending bounced back in October, expanding 1 percent on a monthly basis and 4.3 percent year over year, according to a Dec. 2 release from the U.S. Census Bureau. Spending for the month totaled $611.8 billion on a seasonally adjusted, annualized basis. Additionally, the government revised the September spending figure up to $605.8 billion from $596.1 billion.
"This month's increase in nonresidential construction spending is far more consistent with the anecdotal information floating around the industry, which generally indicates that firms are becoming busier and that backlog is expanding," said Associated Builders and Contractors (ABC) Chief Economist Anirban Basu. "Although last month's numbers for nonresidential construction spending and employment were disappointing and could have implied the nation's nonresidential construction recovery is stalling, that is not the case.
"The outlook for 2015 remains upbeat," said Basu. "The economy has gained momentum over the past six to seven months and that is consistent with more aggressive construction starts and spending during the year to come. Even as the economy has gained momentum, the Federal Reserve has remained extraordinarily accommodative due in part to benign inflation readings. Low interest rates combined with solid economic momentum likely mean expansion for the nonresidential construction industry during the year ahead."
Eleven of the 16 nonresidential construction subsectors posted monthly increases in spending. Here's a recap:
• Office-related construction spending grew by 2 percent in October and is up 16.3 percent from the same time one year ago.
• Lodging construction spending is up 3.3 percent on a monthly basis and is up 15.9 percent on a year-over-year basis.
• Conservation and development-related construction spending grew 4.6 percent for the month and is up 33.1 percent on a yearly basis.
• Spending in the water supply category expanded 0.9 percent on a monthly basis, but is down 1.8 percent on a year-over-year basis.
• Amusement and recreation-related construction spending expanded 2.2 percent in October and is up 1.4 percent from the same time last year.
• Manufacturing-related spending expanded 3.4 percent on a monthly basis and is up 22.2 percent on an annual basis.
• Healthcare-related construction spending expanded 0.6 percent for the month but is down 8.4 percent from the same time last year.
• Education-related construction spending expanded 1.8 percent for the month and is up 3.6 percent on a year-over-year basis.
• Construction spending in the transportation category expanded 2.7 percent on a monthly basis and has expanded 1.6 percent on an annual basis.
• Highway and street-related construction spending expanded 1.2 percent in October and is up 0.1 percent compared to the same time last year.
• Public safety-related construction spending expanded 11.6 percent on a monthly basis but is down 1.2 percent on a year-over-year basis.
Monthly spending in five nonresidential construction subsectors declined in October. They are:
• Commercial construction spending fell 2.2 percent for the month but has grown 9.1 percent on a year-over-year basis.
• Communication construction spending declined 1.9 percent for the month and is down 9.4 percent for the year.
• Religious construction spending fell 3.7 percent for the month and is down 4.6 percent from the same time last year.
• Sewage and waste disposal-related construction spending declined 0.4 percent for the month and is down 0.2 percent on a 12-month basis.
• Power construction spending fell 1 percent for the month but is 0.7 percent higher than at the same time one year ago.
To view the previous spending report, click here.
Related Stories

Sponsored | Designers | Oct 18, 2017
Universal design principles: Part 2
The CDC targets the bathroom as the most dangerous room in the house. Architects can use principles of Universal Design (UD) to reduce these hazards.
Giants 400 | Oct 17, 2017
Top 110 office architecture firms
Gensler, Jacobs, and HOK top BD+C’s ranking of the nation’s largest office sector architecture and AE firms, as reported in the 2017 Giants 300 Report.
Giants 400 | Oct 16, 2017
Data center market forecast: Clearly cloudy
Look for mission-critical construction to double in the next few years.

Resiliency | Oct 13, 2017
Resiliency takes center stage in new projects around the country
Projects like these, where resilience is central to their design and construction, are becoming more commonplace.

Architects | Oct 11, 2017
Architects to policymakers: Buildings are infrastructure, too
Left out of this ongoing national debate over infrastructure are the nation’s other public buildings: the libraries, community centers, courthouses, community college buildings, affordable housing developments, and justice facilities.

Giants 400 | Oct 11, 2017
Top 25 data center architecture firms
Jacobs, Corgan, and Gensler top BD+C’s ranking of the nation’s largest data center sector architecture and AE firms, as reported in the 2017 Giants 300 Report.
Multifamily Housing | Oct 9, 2017
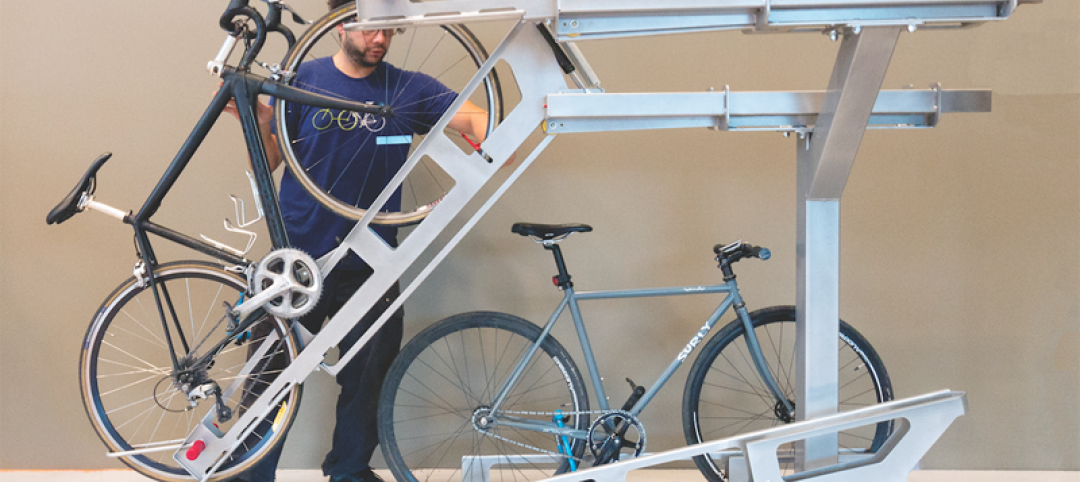
6 new products for the multifamily construction market
Bamboo wall panels, an adaptable prep sink, and a two-tiered bike parking system are among the product innovations geared for multifamily buildings.

AEC Tech | Oct 6, 2017
How professional bias can sabotage industry transformation
Professional bias can take the form of change-resistant thinking that can keep transformational or innovative ambitions at bay. Tech consultant Nate Miller presents three kinds of bias that often emerge when a professional is confronted with new technology.
Giants 400 | Oct 6, 2017
Top 90 K-12 architecture firms
Stantec, DLR Group, and PBK top BD+C’s ranking of the nation’s largest K-12 sector architecture and AE firms, as reported in the 2017 Giants 300 Report.
Giants 400 | Oct 5, 2017
On wings of gold: Alternative financing schemes are propelling the high-flyin’ air terminals sector
The $4 billion renovation of New York City’s LaGuardia Airport is the first major U.S. aviation project delivered using a public-private partnership (P3) model.


