


Nonresidential construction spending bounced back in October, expanding 1 percent on a monthly basis and 4.3 percent year over year, according to a Dec. 2 release from the U.S. Census Bureau. Spending for the month totaled $611.8 billion on a seasonally adjusted, annualized basis. Additionally, the government revised the September spending figure up to $605.8 billion from $596.1 billion.
"This month's increase in nonresidential construction spending is far more consistent with the anecdotal information floating around the industry, which generally indicates that firms are becoming busier and that backlog is expanding," said Associated Builders and Contractors (ABC) Chief Economist Anirban Basu. "Although last month's numbers for nonresidential construction spending and employment were disappointing and could have implied the nation's nonresidential construction recovery is stalling, that is not the case.
"The outlook for 2015 remains upbeat," said Basu. "The economy has gained momentum over the past six to seven months and that is consistent with more aggressive construction starts and spending during the year to come. Even as the economy has gained momentum, the Federal Reserve has remained extraordinarily accommodative due in part to benign inflation readings. Low interest rates combined with solid economic momentum likely mean expansion for the nonresidential construction industry during the year ahead."
Eleven of the 16 nonresidential construction subsectors posted monthly increases in spending. Here's a recap:
• Office-related construction spending grew by 2 percent in October and is up 16.3 percent from the same time one year ago.
• Lodging construction spending is up 3.3 percent on a monthly basis and is up 15.9 percent on a year-over-year basis.
• Conservation and development-related construction spending grew 4.6 percent for the month and is up 33.1 percent on a yearly basis.
• Spending in the water supply category expanded 0.9 percent on a monthly basis, but is down 1.8 percent on a year-over-year basis.
• Amusement and recreation-related construction spending expanded 2.2 percent in October and is up 1.4 percent from the same time last year.
• Manufacturing-related spending expanded 3.4 percent on a monthly basis and is up 22.2 percent on an annual basis.
• Healthcare-related construction spending expanded 0.6 percent for the month but is down 8.4 percent from the same time last year.
• Education-related construction spending expanded 1.8 percent for the month and is up 3.6 percent on a year-over-year basis.
• Construction spending in the transportation category expanded 2.7 percent on a monthly basis and has expanded 1.6 percent on an annual basis.
• Highway and street-related construction spending expanded 1.2 percent in October and is up 0.1 percent compared to the same time last year.
• Public safety-related construction spending expanded 11.6 percent on a monthly basis but is down 1.2 percent on a year-over-year basis.
Monthly spending in five nonresidential construction subsectors declined in October. They are:
• Commercial construction spending fell 2.2 percent for the month but has grown 9.1 percent on a year-over-year basis.
• Communication construction spending declined 1.9 percent for the month and is down 9.4 percent for the year.
• Religious construction spending fell 3.7 percent for the month and is down 4.6 percent from the same time last year.
• Sewage and waste disposal-related construction spending declined 0.4 percent for the month and is down 0.2 percent on a 12-month basis.
• Power construction spending fell 1 percent for the month but is 0.7 percent higher than at the same time one year ago.
To view the previous spending report, click here.
Related Stories

Sponsored | | Jan 3, 2018
4 networking strategies to grow your business
Follow these networking strategies to grow your architectural business with the work that you want.

BD+C University Course | Jan 2, 2018
The art and science of rendering: Visualization that sells architecture [AIA course]
3D artist Ramy Hanna offers guidelines and tricks-of-the-trade to ensure that project artwork is a stunning depiction of the unbuilt space.
Green | Dec 22, 2017
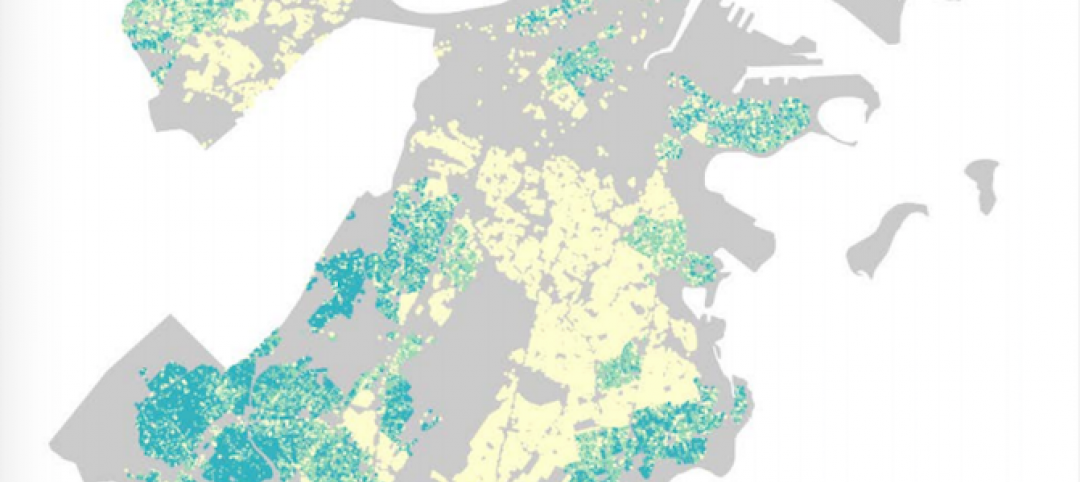
Green builders can use ‘big data’ to make design decisions
More and more, green project teams are relying on publicly available “external datasets” to prioritize sustainable design decisions, says sustainability consultant Adele Houghton.

Reconstruction & Renovation | Dec 21, 2017
Interactive map includes detailed information on historic New York City buildings
The New York City Landmarks Preservation Commission launched a new, enhanced version of its interactive map, Discover NYC Landmarks.

High-rise Construction | Dec 20, 2017
Another record year for high-rise construction
More than 140 skyscrapers were completed across the globe this year, including 15 supertall towers.

Game Changers | Dec 20, 2017
Urban farms can help plant seeds for cities’ growth around them
Urban farms have been impacting cities’ agribusiness—and, on some cases, their redevelopment—for decades.
 reported the November ABI score was 55.0, up from a score of 51.7 in the previous month. Photo: Pixabay")
Market Data | Dec 20, 2017
Architecture billings upturn shows broad strength
The American Institute of Architects (AIA) reported the November ABI score was 55.0, up from a score of 51.7 in the previous month.
Public Health Labs | Dec 19, 2017
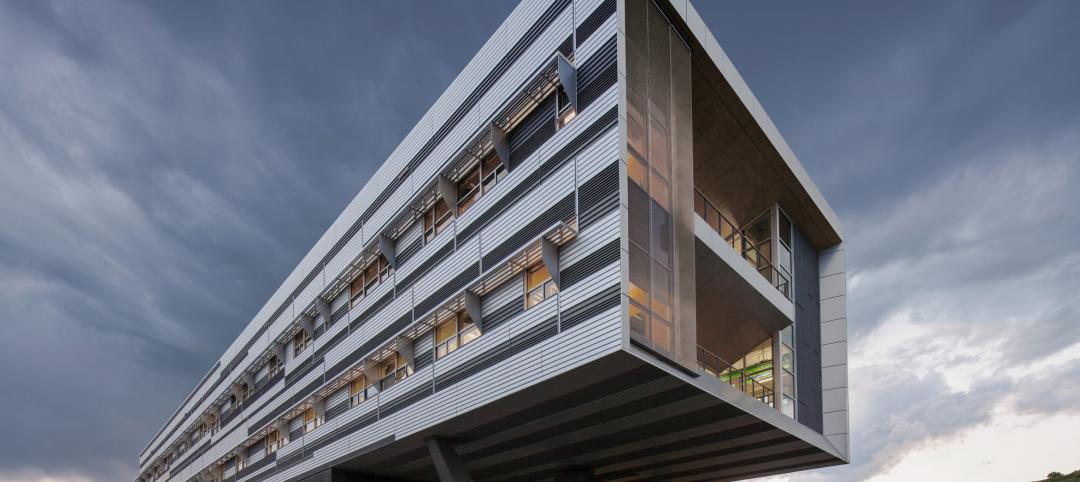
10 takeaways from SmithGroup’s ‘lab of the future’ initiative
The LAB2050 initiative digs into the scientific trends, technologies, and economics that will shape tomorrow’s research laboratory environments.
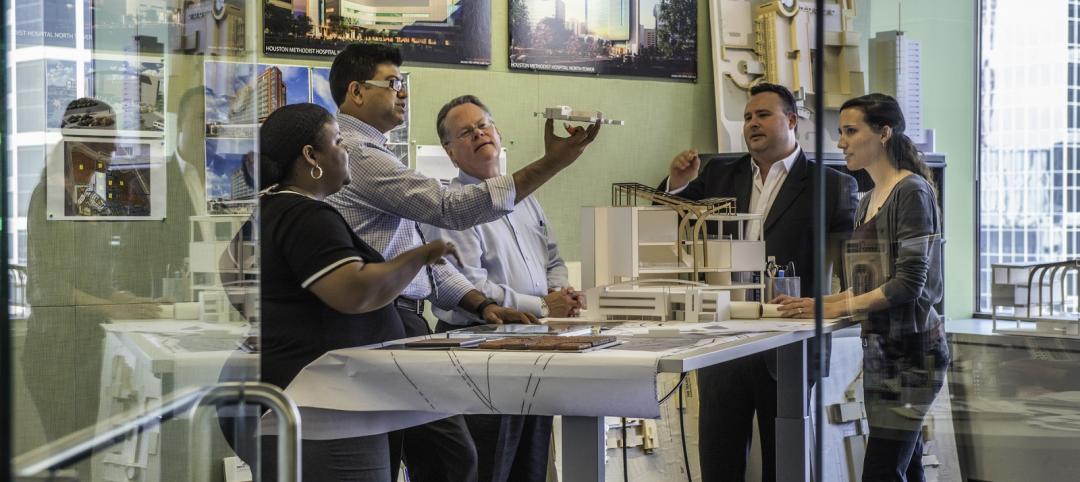
Office Buildings | Dec 19, 2017
How do we measure human performance, and what does it mean for the workplace?
There are many new tools and methods that are beginning to look more comprehensively to evaluate organizational well-being.
Sports and Recreational Facilities | Dec 18, 2017
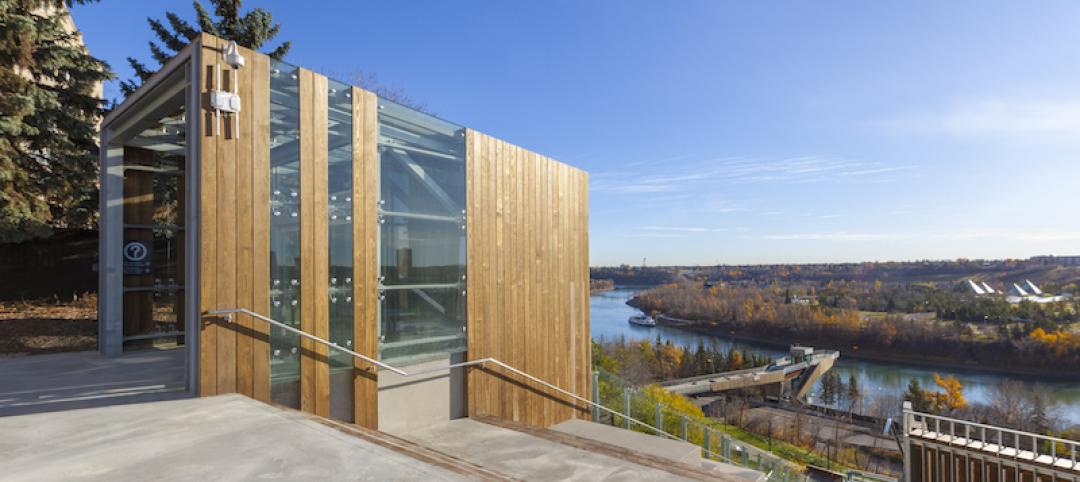
Canada’s newest funicular makes Edmonton’s largest green space more accessible
The incline elevator is located in downtown Edmonton and was publicly funded.


