


Nonresidential construction spending bounced back in October, expanding 1 percent on a monthly basis and 4.3 percent year over year, according to a Dec. 2 release from the U.S. Census Bureau. Spending for the month totaled $611.8 billion on a seasonally adjusted, annualized basis. Additionally, the government revised the September spending figure up to $605.8 billion from $596.1 billion.
"This month's increase in nonresidential construction spending is far more consistent with the anecdotal information floating around the industry, which generally indicates that firms are becoming busier and that backlog is expanding," said Associated Builders and Contractors (ABC) Chief Economist Anirban Basu. "Although last month's numbers for nonresidential construction spending and employment were disappointing and could have implied the nation's nonresidential construction recovery is stalling, that is not the case.
"The outlook for 2015 remains upbeat," said Basu. "The economy has gained momentum over the past six to seven months and that is consistent with more aggressive construction starts and spending during the year to come. Even as the economy has gained momentum, the Federal Reserve has remained extraordinarily accommodative due in part to benign inflation readings. Low interest rates combined with solid economic momentum likely mean expansion for the nonresidential construction industry during the year ahead."
Eleven of the 16 nonresidential construction subsectors posted monthly increases in spending. Here's a recap:
• Office-related construction spending grew by 2 percent in October and is up 16.3 percent from the same time one year ago.
• Lodging construction spending is up 3.3 percent on a monthly basis and is up 15.9 percent on a year-over-year basis.
• Conservation and development-related construction spending grew 4.6 percent for the month and is up 33.1 percent on a yearly basis.
• Spending in the water supply category expanded 0.9 percent on a monthly basis, but is down 1.8 percent on a year-over-year basis.
• Amusement and recreation-related construction spending expanded 2.2 percent in October and is up 1.4 percent from the same time last year.
• Manufacturing-related spending expanded 3.4 percent on a monthly basis and is up 22.2 percent on an annual basis.
• Healthcare-related construction spending expanded 0.6 percent for the month but is down 8.4 percent from the same time last year.
• Education-related construction spending expanded 1.8 percent for the month and is up 3.6 percent on a year-over-year basis.
• Construction spending in the transportation category expanded 2.7 percent on a monthly basis and has expanded 1.6 percent on an annual basis.
• Highway and street-related construction spending expanded 1.2 percent in October and is up 0.1 percent compared to the same time last year.
• Public safety-related construction spending expanded 11.6 percent on a monthly basis but is down 1.2 percent on a year-over-year basis.
Monthly spending in five nonresidential construction subsectors declined in October. They are:
• Commercial construction spending fell 2.2 percent for the month but has grown 9.1 percent on a year-over-year basis.
• Communication construction spending declined 1.9 percent for the month and is down 9.4 percent for the year.
• Religious construction spending fell 3.7 percent for the month and is down 4.6 percent from the same time last year.
• Sewage and waste disposal-related construction spending declined 0.4 percent for the month and is down 0.2 percent on a 12-month basis.
• Power construction spending fell 1 percent for the month but is 0.7 percent higher than at the same time one year ago.
To view the previous spending report, click here.
Related Stories

Architects | Feb 27, 2018
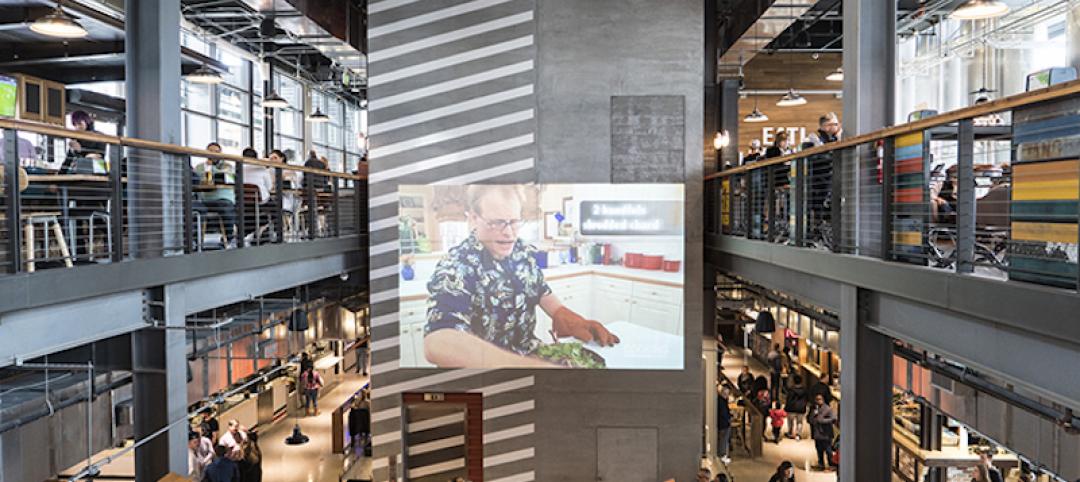
But first, let me take a selfie: Designing sharable moments
The concept of “selfie walls” has been around for years, but with their growing popularity they have begun to evolve and take on a life of their own.

Market Data | Feb 27, 2018
AIA small firm report: Half of employees have ownership stake in their firm
The American Institute of Architects has released its first-ever Small Firm Compensation Report.

Museums | Feb 26, 2018
*UPDATED* Design team unveils plans for the renovated and expanded Gateway Arch Museum
The goal of the project is to create closer and more robust connections between the Gateway Arch Museum and the landscape of the Jefferson National Expansion Memorial.

Architects | Feb 23, 2018
AIA elevates 152 members and two international architects to the College of Fellows
AIA Fellowship recognizes significant contributions to profession of architecture and society.
Airports | Feb 21, 2018
Terminal Modernization: Why Bother? Part II
This is the second post in our series examining why airport operators should bother to upgrade their facilities, even if capacity isn’t forcing the issue.
Urban Planning | Feb 21, 2018
Leading communities in the Second Machine Age
What exactly is the Second Machine Age? The name refers to a book by MIT researchers Erik Brynjolfsson and Andrew McAfee.
Retail Centers | Feb 20, 2018
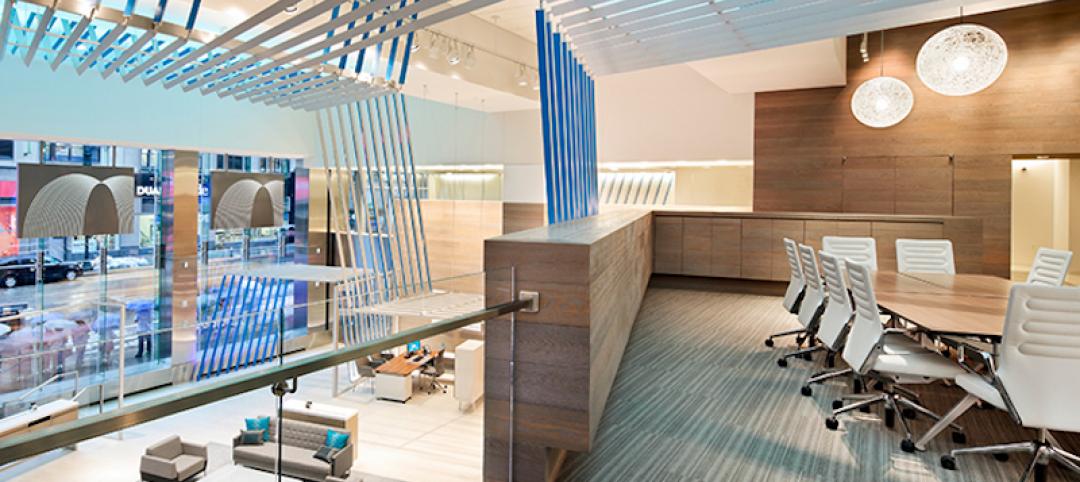
Is there a future in retail banking? Part II
It is critical to not view the physical branch as just another sales channel, but as an important touchpoint along a customer’s journey.
Architects | Feb 15, 2018
AIASF Equity by Design to launch 2018 Equity in Architecture Survey
AIA San Francisco (AIASF) and the Equity by Design Committee, launched the third national Equity in Architecture Survey on February 12, 2018. Building upon the survey conducted in 2016, the third survey will further advance the national movement for equitable practice in the profession.
Urban Planning | Feb 14, 2018
6 urban design trends to watch in 2018
2017 saw the continuation of the evolution of expectations on the part of consumers, developers, office workers, and cities.

Office Buildings | Feb 13, 2018
Office market vacancy rate at 10-year low
Cautious development and healthy absorption across major markets contributed to the decline in vacancy, according to a new Transwestern report.


