


In a recent survey, nearly 900 construction firms reported gains in profitability last year, especially among the top 25% whose financial performances significantly outpaced the respondents as a whole.
The Construction Financial Management Association (CFMA), headquartered in Princeton, N.J., emailed its annual questionnaire to about 8,000 member and nonmember construction firms, as well as member CPA firms that represent construction companies. CFMA received data from 869 companies, which submitted detailed financial statements and other required information.
Thirty-seven percent of the respondents were Industrial & Nonresidential contractors, 19% Heavy & Highway contractors, 43% Specialty Trade contractors, and less than 1% classified as “Other.” The typical company reported total annual sales of $39,710,000 for the 2015 fiscal year. Those with sales under $10 million comprised 16% of responding companies, and 8% of respondents reported sales of over $300 million.
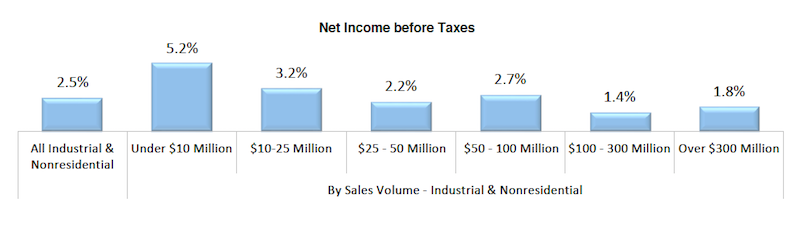
Smaller contracting companies showed stronger earnings last year. Chart: Construction Financial Management Association.
On average, the respondents’ returns on assets and equity rose last year. Returns on Assets was 9%, versus 6.9% in 2014. Returns on equity jumped to 25.3% in 2015, from 19% the previous year.
On the whole, getting paid for services rendered remains a struggle. The respondents’ invoices were in accounts receivable for an average of 55.2 days last year, an increase over the previous two years. As for their accounts payable, the contractors reported a decline to 33.4 days last year, from 35.6 days in 2014.
Gross profits as a percentage of revenue increased to 15%, from 13.1% in 2014. And net income last year stood a 4.4% of sales, versus 3.1% the previous year.
CFMA broke out the financial data by sales volume, and found that companies generating under $10 million in revenue generally had higher profitability ratios than other cohorts. Perhaps coincidentally, the smaller companies had lower debt-to-equity ratios, and significantly lower “underbillings-to-equity” ratios (4.4%, compared to 15.6% for companies with $300 million or more in annual revenue).
Conversely, the largest companies by revenue were more productive, reporting sales per employee of $751,348 ($276,000 more per employee than companies with between $100 million and $300 million in sales, and even higher compared to the other groups), and gross profit per employee of $71,851.
The top-performing contractors—based on a composite ranking of five performance metrics (ROA, ROE, debt to equity, fixed-asset ratios, and gross profit per employee)—were head and shoulders above respondent averages.
The highest achievers reported a 24% Return on Assets and 58.5% Return on Equity, substantively higher on both counts than the survey’s averages noted above.
Best in Class companies also reported less debt (1.2 times debt-to-equity versus 1.8 times for all respondents) and a more stable fixed asset ratio (16.6% versus 25.1% for all respondents). All respondents averaged a 15% gross profit margin, while the Best in Class companies achieved an 18.4% margin. Further, all respondents earned a 4.4% net income before taxes, compared with the highest achievers, which averaged 8.4% margin.
The CFMA survey was compiled and analyzed by Industry Insights and the organization’s Financial Survey & Benchmarker Committee. It did not provide explanations about why some contractors performed better than others.
Related Stories

| Dec 18, 2019
Reconsidering construction robotics
After decades when experts predicted that robots would become more prevalent on construction sites, it would appear that the industry has finally reached that point where necessity, aspiration, and investment are colliding.

75 Top Building Products | Dec 16, 2019
Top Window and Door Products for 2019
Pella’s Rolscreen retractable screen and NanaWall’s HSW single-track sliding glass wall are among the 16 window and door products to make Building Design+Construction’s 2019 101 Top Products report.

75 Top Building Products | Dec 16, 2019
Top Structural Products for 2019
Inpro’s Fireline 140 fire barrier and Owens Corning’s Foamglas cellular glass insulation are among the 10 structural products to make Building Design+Construction's 2019 101 Top Products report.

75 Top Building Products | Dec 16, 2019
101 Top Products for 2019
Building Design+Construction readers and editors select their top building products for the past 12 months in the fourth-annual 101 Top Products report.

75 Top Building Products | Dec 16, 2019
Top Plumbing Products for 2019
Sloan's CX Flushometer and Zip Water's HydroTap are among the eight plumbing products to make Building Design+Construction's 2019 101 Top Products report.

75 Top Building Products | Dec 16, 2019
Top Interior Building Products for 2019
Arktura's Delta Drop ceiling and CertainTeed's Decoustics Rondolo wood panels are among the 13 new interior products to make Building Design+Construction's 2019 101 Top Products report.

75 Top Building Products | Dec 16, 2019
Top Glass and Glazing Products for 2019
SageGlass's Harmony dynamic glass and Vitro Architectural Glass's Acuity low-iron glass are among the nine new glass and glazing products to make Building Design+Construction's 2019 101 Top Products report.

75 Top Building Products | Dec 16, 2019
Top Flooring Products for 2019
Tarkett’s aviation-inspired flooring collection and J+J Flooring’s textile composite flooring are among the four new commercial flooring products to make Building Design+Construction’s 2019 101 Top Products report.

75 Top Building Products | Dec 16, 2019
Top Building Systems Products for 2019
FabricAir’s ceiling-hung fabric duct and Ellumi Lighting’s bacteria-killing lights are among the 13 new building systems products to make Building Design+Construction's 2019 101 Top Products report.

75 Top Building Products | Dec 12, 2019
Top Building Envelope Products for 2019
Sto's beetle-inspired exterior coating and Dörken Systems' UV-resistant vapor-permeable barrier are among the 28 new building envelope products to make Building Design+Construction's 2019 101 Top Products report.


