


In a recent survey, nearly 900 construction firms reported gains in profitability last year, especially among the top 25% whose financial performances significantly outpaced the respondents as a whole.
The Construction Financial Management Association (CFMA), headquartered in Princeton, N.J., emailed its annual questionnaire to about 8,000 member and nonmember construction firms, as well as member CPA firms that represent construction companies. CFMA received data from 869 companies, which submitted detailed financial statements and other required information.
Thirty-seven percent of the respondents were Industrial & Nonresidential contractors, 19% Heavy & Highway contractors, 43% Specialty Trade contractors, and less than 1% classified as “Other.” The typical company reported total annual sales of $39,710,000 for the 2015 fiscal year. Those with sales under $10 million comprised 16% of responding companies, and 8% of respondents reported sales of over $300 million.
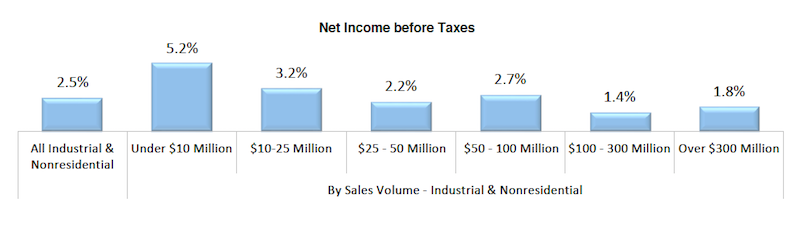
Smaller contracting companies showed stronger earnings last year. Chart: Construction Financial Management Association.
On average, the respondents’ returns on assets and equity rose last year. Returns on Assets was 9%, versus 6.9% in 2014. Returns on equity jumped to 25.3% in 2015, from 19% the previous year.
On the whole, getting paid for services rendered remains a struggle. The respondents’ invoices were in accounts receivable for an average of 55.2 days last year, an increase over the previous two years. As for their accounts payable, the contractors reported a decline to 33.4 days last year, from 35.6 days in 2014.
Gross profits as a percentage of revenue increased to 15%, from 13.1% in 2014. And net income last year stood a 4.4% of sales, versus 3.1% the previous year.
CFMA broke out the financial data by sales volume, and found that companies generating under $10 million in revenue generally had higher profitability ratios than other cohorts. Perhaps coincidentally, the smaller companies had lower debt-to-equity ratios, and significantly lower “underbillings-to-equity” ratios (4.4%, compared to 15.6% for companies with $300 million or more in annual revenue).
Conversely, the largest companies by revenue were more productive, reporting sales per employee of $751,348 ($276,000 more per employee than companies with between $100 million and $300 million in sales, and even higher compared to the other groups), and gross profit per employee of $71,851.
The top-performing contractors—based on a composite ranking of five performance metrics (ROA, ROE, debt to equity, fixed-asset ratios, and gross profit per employee)—were head and shoulders above respondent averages.
The highest achievers reported a 24% Return on Assets and 58.5% Return on Equity, substantively higher on both counts than the survey’s averages noted above.
Best in Class companies also reported less debt (1.2 times debt-to-equity versus 1.8 times for all respondents) and a more stable fixed asset ratio (16.6% versus 25.1% for all respondents). All respondents averaged a 15% gross profit margin, while the Best in Class companies achieved an 18.4% margin. Further, all respondents earned a 4.4% net income before taxes, compared with the highest achievers, which averaged 8.4% margin.
The CFMA survey was compiled and analyzed by Industry Insights and the organization’s Financial Survey & Benchmarker Committee. It did not provide explanations about why some contractors performed better than others.
Related Stories

Giants 400 | Sep 9, 2019
2019 Industrial Sector Giants Report: Managing last mile delivery
This and more industrial building sector trends from Building Design+Construction's 2019 Giants 300 Report.

Codes and Standards | Sep 9, 2019
Free app calculates maximum allowable heights and areas for buildings
A free app that calculates the maximum allowable heights and areas for buildings of various occupancy classifications and types of construction has been released.

Retail Centers | Sep 6, 2019
Another well-known retailer files for bankruptcy: Here's the solution to more empty anchor stores
Where can you find the future of retail? At the intersection of experience and instant gratification.

Giants 400 | Sep 5, 2019
Top 85 Hotel Sector Construction Firms for 2019
Suffolk, Yates Companies, AECOM, Swinerton, and Turner top the rankings of the nation's largest hotel sector contractors and construction management firms, as reported in Building Design+Construction's 2019 Giants 300 Report.

Contractors | Sep 5, 2019
Katerra adds two GCs to its stable
UEB Builders and Fortune-Johnson General Contractors specialize in multifamily and mixed-used developments.

Giants 400 | Sep 4, 2019
Top 90 K-12 School Sector Construction Firms for 2019
Gilbane, Balfour Beatty, Turner, CORE Construction, and Skanska lead the rankings of the nation's largest K-12 school sector contractors and construction management firms, as reported in Building Design+Construction's 2019 Giants 300 Report.

Market Data | Sep 3, 2019
Nonresidential construction spending slips in July 2019, but still surpasses $776 billion
Construction spending declined 0.3% in July, totaling $776 billion on a seasonally adjusted annualized basis.

Giants 400 | Aug 30, 2019
2019 K-12 School Giants Report: 360-degree learning among top school design trends for 2019
K-12 school districts are emphasizing practical, hands-on experience and personalized learning.

Industry Research | Aug 29, 2019
Construction firms expect labor shortages to worsen over the next year
A new AGC-Autodesk survey finds more companies turning to technology to support their jobsites.

Codes and Standards | Aug 29, 2019
Industry leaders ask for government help as trades shortage worsens
AGC asks for more funding for education and increased immigration to fill gaps.


