


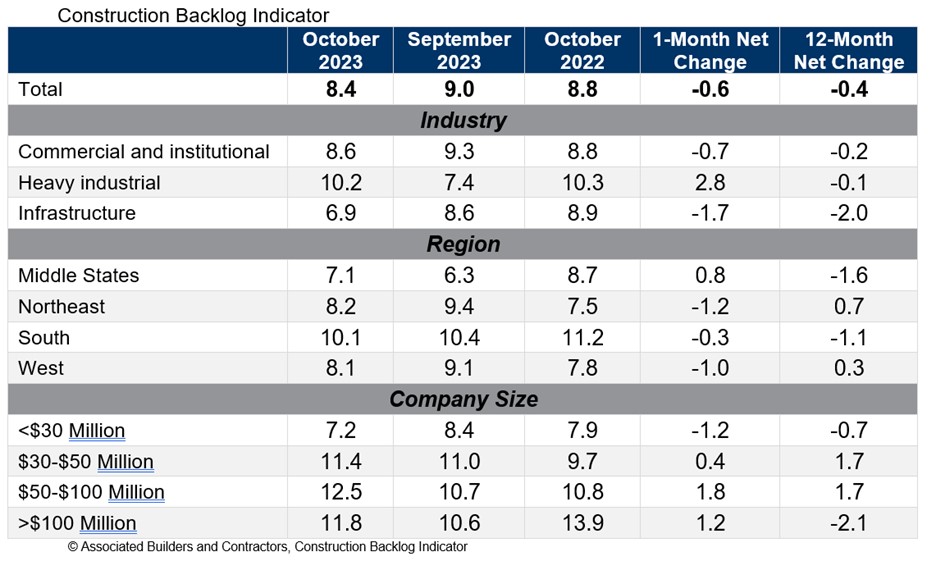
Associated Builders and Contractors reported that its Construction Backlog Indicator declined to 8.4 months in October from 9.0 months in September, according to an ABC member survey conducted from Oct. 19 to Nov. 2. The reading is down 0.4 months from October 2022.
Backlog now stands at its lowest level since the first quarter of 2022. Declines were concentrated among the smallest contractors, those with less than $30 million in annual revenues. All three other revenue categories experienced an increase in backlog in October.
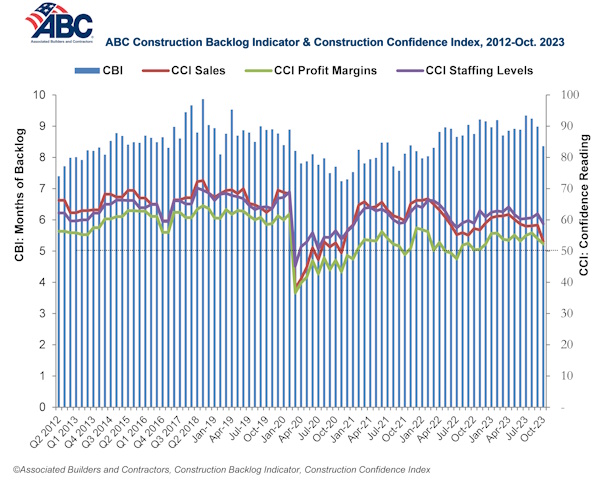
ABC’s Construction Confidence Index readings for sales, staffing levels and profit margins fell in October. All three readings remain above the threshold of 50, indicating expectations for growth over the next six months.
“While larger contractors continue to disproportionately benefit from a bevy of megaprojects around the nation, many smaller contractors are feeling the sting of weaker economic fundamentals in struggling commercial real estate segments,” said ABC Chief Economist Anirban Basu. “Smaller contractors are often the ones most dependent on developer-driven activity. With developers facing both higher borrowing costs and greater difficulty lining up project financing, backlog among some contractors is beginning to dissipate.
“This is precisely what ABC economists predicted,” said Basu. “The vast majority of contractors could boast healthy backlog, especially those working in the manufacturing/industrial, infrastructure, data center and health care segments. But those tied to the office, shopping center and multifamily markets are likely experiencing difficulty lining up work. This helps explain declines in the readings for ABC’s Construction Confidence Index in all three dimensions: sales, employment and margins. Each of these readings, however, remains above 50, suggesting that, while industry growth is softening, it has yet to enter contractionary territory.”
Related Stories

Market Data | Feb 14, 2019
U.S. Green Building Council announces top 10 countries and regions for LEED green building
The list ranks countries and regions in terms of cumulative LEED-certified gross square meters as of December 31, 2018.

Market Data | Feb 13, 2019
Increasingly tech-enabled construction industry powers forward despite volatility
Construction industry momentum to carry through first half of 2019.

Market Data | Feb 4, 2019
U.S. Green Building Council announces annual Top 10 States for LEED Green Building in 2018
Illinois takes the top spot as USGBC defines the next generation of green building with LEED v4.1.

Market Data | Feb 4, 2019
Nonresidential construction spending dips in November
Total nonresidential spending stood at $751.5 billion on a seasonally adjusted annualized rate.

Market Data | Feb 1, 2019
The year-end U.S. hotel construction pipeline continues steady growth trend
Project counts in the early planning stage continue to rise reaching an all-time high of 1,723 projects/199,326 rooms.

Market Data | Feb 1, 2019
Construction spending is projected to increase by more than 11% through 2022
FMI’s annual outlook also expects the industry’s frantic M&A activity to be leavened by caution going forward.

Market Data | Jan 23, 2019
Architecture billings slow, but close 2018 with growing demand
AIA’s Architecture Billings Index (ABI) score for December was 50.4 compared to 54.7 in November.

Market Data | Jan 16, 2019
AIA 2019 Consensus Forecast: Nonresidential construction spending to rise 4.4%
The education, public safety, and office sectors will lead the growth areas this year, but AIA's Kermit Baker offers a cautious outlook for 2020.

Market Data | Dec 19, 2018
Brokers look forward to a commercial real estate market that mirrors 2018’s solid results
Respondents to a recent Transwestern poll expect flat to modest growth for rents and investment in offices, MOBs, and industrial buildings.

Market Data | Dec 19, 2018
When it comes to economic clout, New York will far outpace other U.S. metros for decades to come
But San Jose, Calif., is expected to have the best annual growth rate through 2035, according to Oxford Economics’ latest Global Cities report.


