


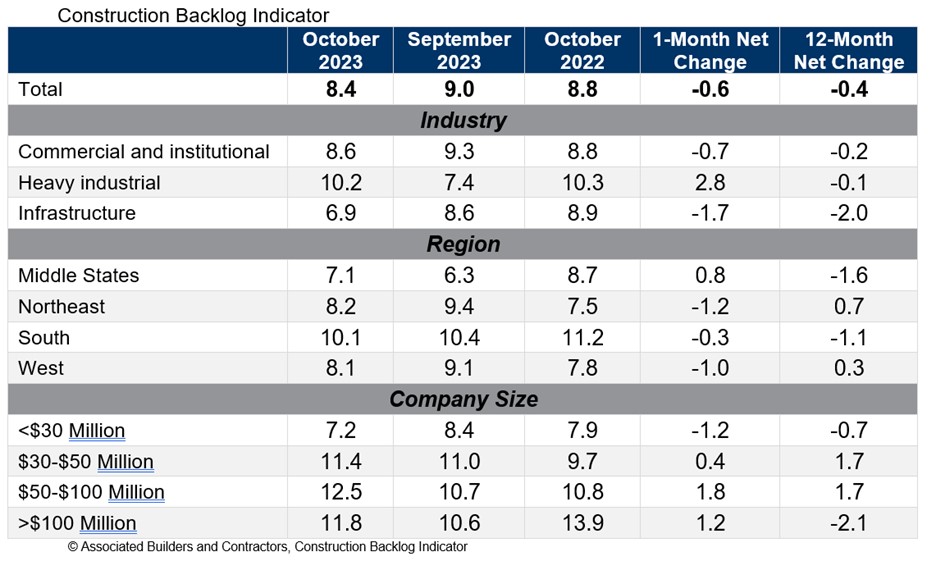
Associated Builders and Contractors reported that its Construction Backlog Indicator declined to 8.4 months in October from 9.0 months in September, according to an ABC member survey conducted from Oct. 19 to Nov. 2. The reading is down 0.4 months from October 2022.
Backlog now stands at its lowest level since the first quarter of 2022. Declines were concentrated among the smallest contractors, those with less than $30 million in annual revenues. All three other revenue categories experienced an increase in backlog in October.
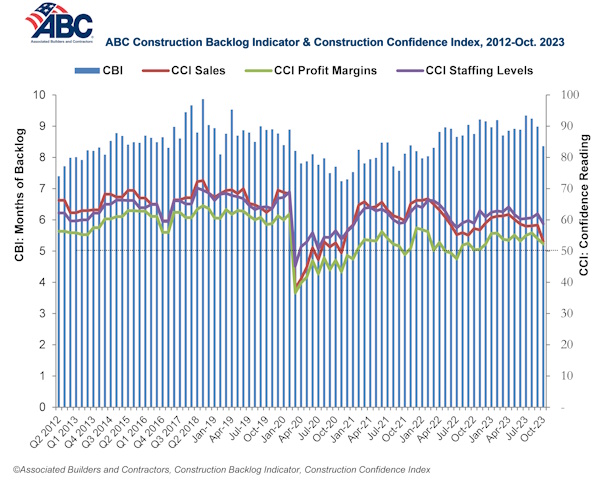
ABC’s Construction Confidence Index readings for sales, staffing levels and profit margins fell in October. All three readings remain above the threshold of 50, indicating expectations for growth over the next six months.
“While larger contractors continue to disproportionately benefit from a bevy of megaprojects around the nation, many smaller contractors are feeling the sting of weaker economic fundamentals in struggling commercial real estate segments,” said ABC Chief Economist Anirban Basu. “Smaller contractors are often the ones most dependent on developer-driven activity. With developers facing both higher borrowing costs and greater difficulty lining up project financing, backlog among some contractors is beginning to dissipate.
“This is precisely what ABC economists predicted,” said Basu. “The vast majority of contractors could boast healthy backlog, especially those working in the manufacturing/industrial, infrastructure, data center and health care segments. But those tied to the office, shopping center and multifamily markets are likely experiencing difficulty lining up work. This helps explain declines in the readings for ABC’s Construction Confidence Index in all three dimensions: sales, employment and margins. Each of these readings, however, remains above 50, suggesting that, while industry growth is softening, it has yet to enter contractionary territory.”
Related Stories

Market Data | Aug 19, 2019
Multifamily market sustains positive cycle
Year-over-year growth tops 3% for 13th month. Will the economy stifle momentum?

Market Data | Aug 16, 2019
Students say unclean restrooms impact their perception of the school
The findings are part of Bradley Corporation’s Healthy Hand Washing Survey.

Market Data | Aug 12, 2019
Mid-year economic outlook for nonresidential construction: Expansion continues, but vulnerabilities pile up
Emerging weakness in business investment has been hinting at softening outlays.

Market Data | Aug 7, 2019
National office vacancy holds steady at 9.7% in slowing but disciplined market
Average asking rental rate posts 4.2% annual growth.

Market Data | Aug 1, 2019
Nonresidential construction spending slows in June, remains elevated
Among the 16 nonresidential construction spending categories tracked by the Census Bureau, seven experienced increases in monthly spending.

Market Data | Jul 31, 2019
For the second quarter of 2019, the U.S. hotel construction pipeline continued its year-over-year growth spurt
The growth spurt continued even as business investment declined for the first time since 2016.

Market Data | Jul 23, 2019
Despite signals of impending declines, continued growth in nonresidential construction is expected through 2020
AIA’s latest Consensus Construction Forecast predicts growth.

Market Data | Jul 20, 2019
Construction costs continued to rise in second quarter
Labor availability is a big factor in that inflation, according to Rider Levett Bucknall report.

Market Data | Jul 18, 2019
Construction contractors remain confident as summer begins
Contractors were slightly less upbeat regarding profit margins and staffing levels compared to April.

Market Data | Jul 17, 2019
Design services demand stalled in June
Project inquiry gains hit a 10-year low.


