Following consistently increasing demand for design services throughout most of 2013, the Architecture Billings Index (ABI) has posted its first consecutive months of contraction since May and June of 2012.
As a leading economic indicator of construction activity, the ABI reflects the approximate nine to twelve month lead time between architecture billings and construction spending.
The American Institute of Architects (AIA) reported the December ABI score was 48.5, down from a mark of 49.8 in November. This score reflects a decrease in design services (any score above 50 indicates an increase in billings).
The new projects inquiry index was 59.2, up from the reading of 57.8 the previous month.
“What we thought last month was an isolated dip now bears closer examination to see what is causing the slowdown in demand for architectural services,” said AIA Chief Economist Kermit Baker, Hon. AIA, PhD. “It is possible that some of this can be attributed to the anxiety in the marketplace caused by the shutdown of the federal government, but it will be important to see how business conditions fare through the first quarter of the new year when we no longer have end of the year issues to deal with.”
Key December ABI highlights:
• Regional averages: West (53.2), South (51.2), Midwest (47.0), Northeast (42.8)
• Sector index breakdown: multi-family residential (53.8), mixed practice 51.0), commercial / industrial (47.1), institutional (44.8)
• Project inquiries index: 59.2
Note: The regional and sector categories are calculated as a 3-month moving average, whereas the index and inquiries are monthly numbers.
About the AIA Architecture Billings Index
The Architecture Billings Index (ABI), produced by the AIA Economics & Market Research Group, is a leading economic indicator that provides an approximately nine to twelve month glimpse into the future of nonresidential construction spending activity. The diffusion indexes contained in the full report are derived from a monthly “Work-on-the-Boards” survey that is sent to a panel of AIA member-owned firms.
Participants are asked whether their billings increased, decreased, or stayed the same in the month that just ended as compared to the prior month, and the results are then compiled into the ABI. These monthly results are also seasonally adjusted to allow for comparison to prior months. The monthly ABI index scores are centered around 50, with scores above 50 indicating an aggregate increase in billings, and scores below 50 indicating a decline. The regional and sector data are formulated using a three-month moving average.
More information on the ABI and the analysis of its relationship to construction activity can be found in the White Paper Architecture Billings as a Leading Indicator of Construction: Analysis of the Relationship Between a Billings Index and Construction Spending on the AIA website.
Related Stories
Cultural Facilities | Nov 21, 2023
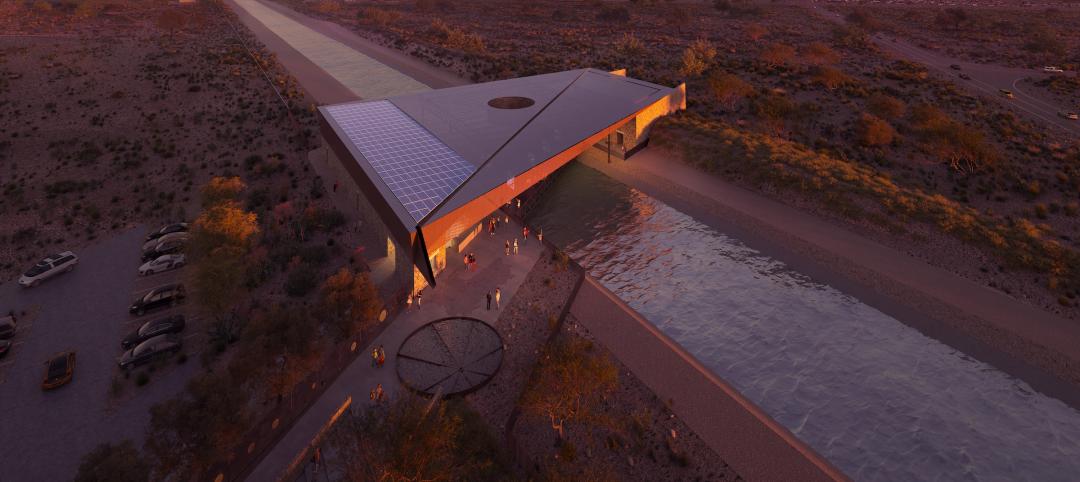
Arizona’s Water Education Center will teach visitors about water conservation and reuse strategies
Phoenix-based architecture firm Jones Studio will design the Water Education Center for Central Arizona Project (CAP)—a 336-mile aqueduct system that delivers Colorado River water to almost 6 million people, more than 80% of the state’s population. The Center will allow the public to explore CAP’s history, operations, and impact on Arizona.
MFPRO+ New Projects | Nov 21, 2023
An 'eco-obsessed' multifamily housing project takes advantage of downtown Austin’s small lots
In downtown Austin, Tex., architecture firm McKinney York says it built Capitol Quarters to be “eco-obsessed, not just eco-minded.” With airtight walls, better insulation, and super-efficient VRF (variable refrigerant flow) systems, Capitol Quarters uses 30% less energy than other living spaces in Austin, according to a statement from McKinney York.
MFPRO+ News | Nov 21, 2023
California building electrification laws could prompt more evictions and rent increases
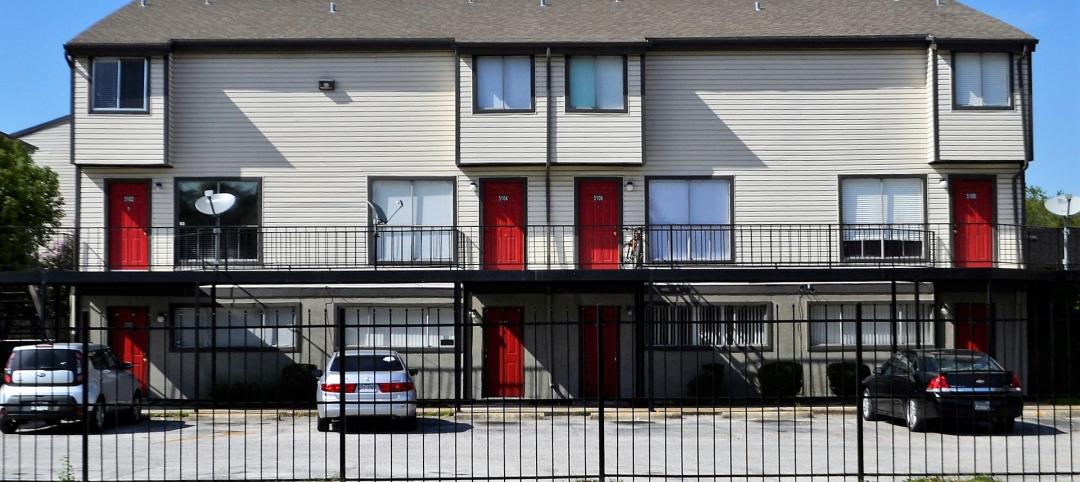
California laws requiring apartment owners to ditch appliances that use fossil fuels could prompt more evictions and rent increases in the state, according to a report from the nonprofit Strategic Actions for a Just Economy. The law could spur more evictions if landlords undertake major renovations to comply with the electrification rule.
Codes and Standards | Nov 21, 2023
Austin becomes largest U.S. city to waive minimum parking requirements
Austin, Texas recently became the largest city in the United States to stop requiring new developments to set a minimum amount of parking. The Austin City Council voted 8-2 earlier this month to eliminate parking requirements in an effort to fight climate change and spur more housing construction as Texas’s capitol grapples with a housing affordability crisis.
MFPRO+ News | Nov 21, 2023
Underused strip malls offer great potential for conversions to residential use
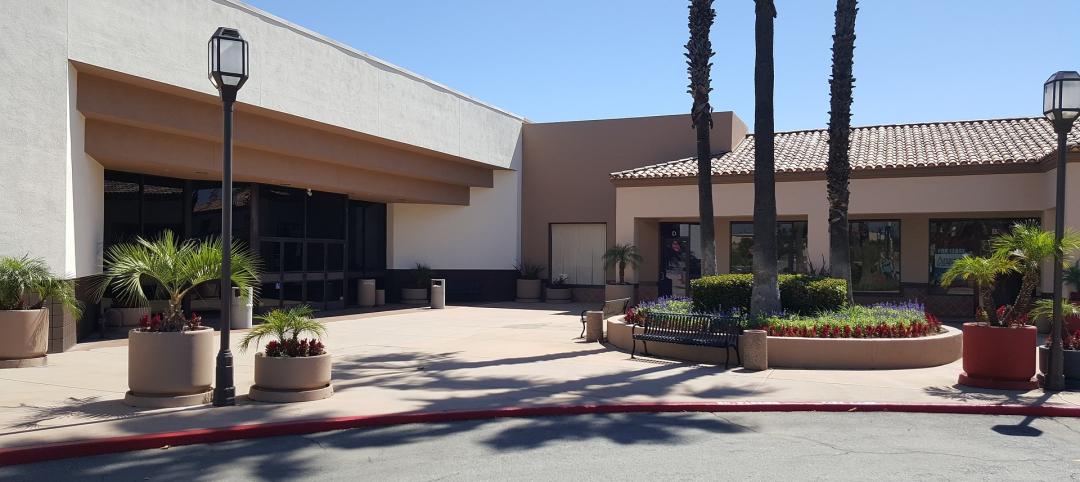
Replacing moribund strip malls with multifamily housing could make a notable dent in the housing shortage and revitalize under-used properties across the country, according to a report from housing nonprofit Enterprise Community Partners.
Giants 400 | Nov 16, 2023
Top 100 Science + Technology Facility Architecture Firms for 2023
Gensler, HDR, Page Southerland Page, Flad Architects, and DGA top BD+C's ranking of the nation's largest science and technology (S+T) facility architecture and architecture/engineering (AE) firms for 2023, as reported in Building Design+Construction's 2023 Giants 400 Report. Note: This ranking factors revenue from all science and technology (S+T) buildings work, including laboratories, research buildings, technology/innovation buildings, pharmaceutical production facilities, and semiconductor production facilities.
Resiliency | Nov 16, 2023
How inclusive design supports resilience and climate preparedness
Gail Napell, AIA, LEED AP BD+C, shares five tips and examples of inclusive design across a variety of building sectors.
Retail Centers | Nov 15, 2023
Should retail developers avoid high crime areas?
For retailers resolute to operating in high crime areas, design elements exist to mitigate losses and potentially deter criminal behavior.
MFPRO+ News | Nov 15, 2023
Average U.S multifamily rents drop $3 to $1,718 in October 2023: Yardi Matrix
Multifamily fundamentals continued to soften and impact rents last month, according to the latest Yardi Matrix National Multifamily Report. The average U.S. asking rent dropped $3 to $1,718 in October, with year-over-year growth moderating to 0.4%, down 40 basis points from September. Occupancy slid to 94.9%, marking the first decline in four months.
MFPRO+ Special Reports | Nov 14, 2023
Register today! Key trends in the multifamily housing market for 2024 - BD+C Live Webinar
Join the BD+C and Multifamily Pro+ editorial team for this live webinar on key trends and innovations in the $110 billion U.S. multifamily housing market. A trio of multifamily design and construction experts will present their latest projects, trends, innovations, and data/research on the three primary multifamily sub-sectors: rental housing, senior living, and student housing.


