


The New York metropolitan area is on track to generate $1.797 trillion in gross domestic product in 2019, which would rank first among all metros in the United States by a wide margin. New York is projected to hold onto that ranking through at least 2035, when its GDP could reach $2.511 trillion, according to the annual Global Cities report published by Oxford Economics, a London-based independent global advisory firm.
The change in New York’s GDP would represent 2% annual growth, driven by a finance and business services sector that is the largest of any major world city. However, Oxford Economics projects that San Jose, Calif., with its high-tech and entrepreneurial ecosystem, will lead all American metros in annual GDP growth through 2035, at 3%, followed by Portland, Ore., and Austin, Texas (2.6%), and Seattle, Charlotte, N.C., Nashville, and San Francisco (2.4%).
Oxford believes that San Jose’s greatest asset is the “scale and diversity of its technical workforce.” This metro’s annual GDP growth averaged 7.4% during the years 2013-17. In Portland, where manufacturing accounts for roughly 40% of its annual growth, high-tech production is expected to sustain its robust economy.
Nashville, whose population has roughly doubled in the last 40 years, was recently chosen by Amazon for a new operations center that will employ 5,000 people. Apple plans to invest $1 billion in Austin, where the tech giant could eventually employ 15,000 people.
Behind New York, the cities that rank highest for projected GDP for 2019 and 2035 are Tokyo, Los Angeles, and London. L.A.’s GDP is expected to hit $1.093 trillion next year, and expand by 41.4% to $1.545 trillion in 2035. Oxford expressed some surprise about L.A.’s likely position, given that its financial and business services sector only accounts for 39% of its economy. But L.A.’s west-coast location and economic diversity are surely benefits.
Oxford also considers urban economies in terms of industrial output. On that score, two Texas cities, Houston and Dallas, are being driven by their low-tax, low-regulation model, and relatively abundant land, to achieve strength in moderately high-value manufacturing segments. (Dallas and Houston are ranked 4th and 7th, respectively, in projected 2019 and 2035 GDP.)
Conversely, Oxford wonders about Chicago’s prospects. The Windy City ranks third in projected GDP for both years tracked, but its financial and business services sector, relative to the city’s size, is actually smaller than Boston’s, San Francisco’s, and Washington D.C.’s.
“Fundamentally, it is tough being a Midwest city such as Chicago: regional growth is not so strong; many corporate headquarters and production facilities have moved south in search of lower taxes, laxer regulations, cheaper costs and more sun; and the start-up and tech scenes are elsewhere,” writes Oxford. On the other hand, Oxford points out that naysayers who wrote off Chicago in past years have been proven wrong because Chicago continues to offer “acceptable compromises,” such as affordability, livability, and opportunity, that keep it competitive nationally and globally.
While a large share of America’s GDP is clustered within its 10 largest cities, Oxford Economics notes that around two-thirds of U.S. economic output still comes from medium- and small-sized cities and towns. Of the top 20 metros by forecasted GDP growth through 2022, nine have fewer than 500,000 people. Many of these cities are located in the Southwest and Mountain regions, and benefit from an improved energy sector, immigration (although that remains an uncertainty, given the current political climate), and an evolving economic base.
Fastest growing U.S. cities 2019-35
Rank City avg. annual % growth
1 San Jose 3.0
2 Portland 2.6
3 Austin 2.6
4 Seattle 2.4
5 Charlotte 2.4
6 Nashville 2.4
7 San Francisco 2.4
8 Orlando 2.3
9 Dallas 2.3
10 Salt Lake 2.3
Top U.S. cities by size of economy
Rank 2035 Rank 2019 City GDP GDP % chg.
$B 2019 $B 2035
1 1 New York 1,797 2,511 39.7
2 2 Los Angeles 1,093 1,545 41.4
3 3 Chicago 713 957 34.3
4 4 Dallas 573 839 46.4
5 6 San Francisco 532 796 49.6
6 5 Washington 559 779 39.3
7 7 Houston 529 758 43.2
8 9 Boston 461 656 42.5
9 8 Philadelphia 467 650 39.4
10 10 Atlanta 402 575 42.9
Source: Oxford Economics
Related Stories

Market Data | Apr 29, 2020
5 must reads for the AEC industry today: April 29, 2020
A new Human performance Center and Construction employment declines in 99 metro areas.

Market Data | Apr 29, 2020
Construction employment declines in 99 metro areas in March from 2019
Industry officials call for new state and federal funding to add jobs.

Market Data | Apr 28, 2020
5 must reads for the AEC industry today: April 28, 2020
A virtual 'city-forest' to help solve population density challenges and planning for life in cities after the pandemic.

Market Data | Apr 27, 2020
5 must reads for the AEC industry today: April 27, 2020
Colleges begin building campus eSports arenas and PCL Construction rolls out portable coronavirus testing centers.

Market Data | Apr 24, 2020
6 must reads for the AEC industry today: April 24, 2020
Take a virtual tour of Frank Lloyd Wright's Robie House and Construction Contractor Confidence plummets.

Market Data | Apr 23, 2020
Construction Contractor Confidence plummets in February
As of February 2020, fewer than 30% of contractors expected their sales to increase over the next six months.

Market Data | Apr 23, 2020
5 must reads for the AEC industry today: April 23, 2020
The death of the department store and how to return to work when the time comes.

Market Data | Apr 22, 2020
6 must reads for the AEC industry today: April 22, 2020
Repurposed containers can be used as rapid response airborne infection isolation rooms and virtual site visits help control infection on project sites.
Market Data | Apr 21, 2020
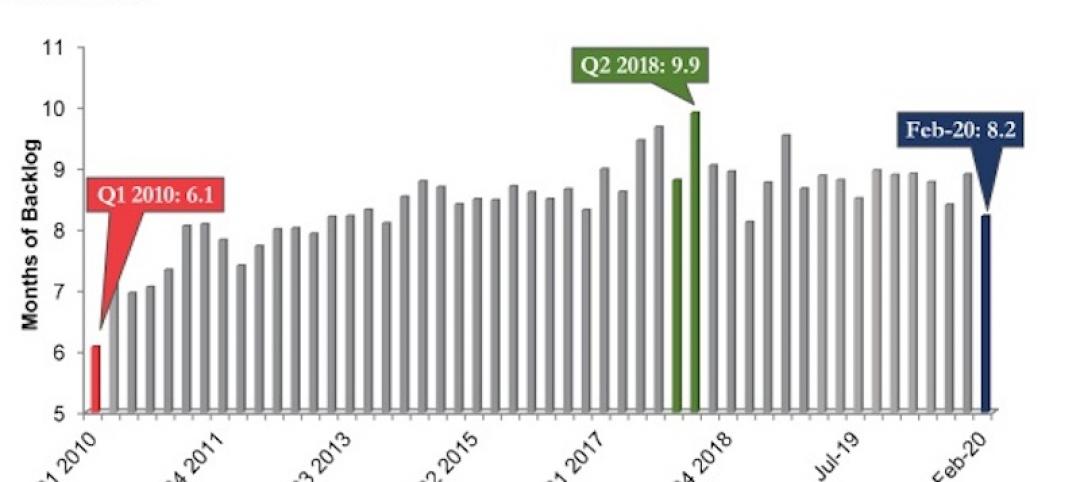
ABC's Construction Backlog Indicator down in February
Backlog for firms working in the infrastructure segment rose by 1.3 months in February while backlog for commercial and institutional and heavy industrial firms declined by 0.6 months and 0.7 months, respectively.

Market Data | Apr 21, 2020
5 must reads for the AEC industry today: April 21, 2020
IoT system helps contractors keep their distance and the multifamily market flattens.


