


The New York metropolitan area is on track to generate $1.797 trillion in gross domestic product in 2019, which would rank first among all metros in the United States by a wide margin. New York is projected to hold onto that ranking through at least 2035, when its GDP could reach $2.511 trillion, according to the annual Global Cities report published by Oxford Economics, a London-based independent global advisory firm.
The change in New York’s GDP would represent 2% annual growth, driven by a finance and business services sector that is the largest of any major world city. However, Oxford Economics projects that San Jose, Calif., with its high-tech and entrepreneurial ecosystem, will lead all American metros in annual GDP growth through 2035, at 3%, followed by Portland, Ore., and Austin, Texas (2.6%), and Seattle, Charlotte, N.C., Nashville, and San Francisco (2.4%).
Oxford believes that San Jose’s greatest asset is the “scale and diversity of its technical workforce.” This metro’s annual GDP growth averaged 7.4% during the years 2013-17. In Portland, where manufacturing accounts for roughly 40% of its annual growth, high-tech production is expected to sustain its robust economy.
Nashville, whose population has roughly doubled in the last 40 years, was recently chosen by Amazon for a new operations center that will employ 5,000 people. Apple plans to invest $1 billion in Austin, where the tech giant could eventually employ 15,000 people.
Behind New York, the cities that rank highest for projected GDP for 2019 and 2035 are Tokyo, Los Angeles, and London. L.A.’s GDP is expected to hit $1.093 trillion next year, and expand by 41.4% to $1.545 trillion in 2035. Oxford expressed some surprise about L.A.’s likely position, given that its financial and business services sector only accounts for 39% of its economy. But L.A.’s west-coast location and economic diversity are surely benefits.
Oxford also considers urban economies in terms of industrial output. On that score, two Texas cities, Houston and Dallas, are being driven by their low-tax, low-regulation model, and relatively abundant land, to achieve strength in moderately high-value manufacturing segments. (Dallas and Houston are ranked 4th and 7th, respectively, in projected 2019 and 2035 GDP.)
Conversely, Oxford wonders about Chicago’s prospects. The Windy City ranks third in projected GDP for both years tracked, but its financial and business services sector, relative to the city’s size, is actually smaller than Boston’s, San Francisco’s, and Washington D.C.’s.
“Fundamentally, it is tough being a Midwest city such as Chicago: regional growth is not so strong; many corporate headquarters and production facilities have moved south in search of lower taxes, laxer regulations, cheaper costs and more sun; and the start-up and tech scenes are elsewhere,” writes Oxford. On the other hand, Oxford points out that naysayers who wrote off Chicago in past years have been proven wrong because Chicago continues to offer “acceptable compromises,” such as affordability, livability, and opportunity, that keep it competitive nationally and globally.
While a large share of America’s GDP is clustered within its 10 largest cities, Oxford Economics notes that around two-thirds of U.S. economic output still comes from medium- and small-sized cities and towns. Of the top 20 metros by forecasted GDP growth through 2022, nine have fewer than 500,000 people. Many of these cities are located in the Southwest and Mountain regions, and benefit from an improved energy sector, immigration (although that remains an uncertainty, given the current political climate), and an evolving economic base.
Fastest growing U.S. cities 2019-35
Rank City avg. annual % growth
1 San Jose 3.0
2 Portland 2.6
3 Austin 2.6
4 Seattle 2.4
5 Charlotte 2.4
6 Nashville 2.4
7 San Francisco 2.4
8 Orlando 2.3
9 Dallas 2.3
10 Salt Lake 2.3
Top U.S. cities by size of economy
Rank 2035 Rank 2019 City GDP GDP % chg.
$B 2019 $B 2035
1 1 New York 1,797 2,511 39.7
2 2 Los Angeles 1,093 1,545 41.4
3 3 Chicago 713 957 34.3
4 4 Dallas 573 839 46.4
5 6 San Francisco 532 796 49.6
6 5 Washington 559 779 39.3
7 7 Houston 529 758 43.2
8 9 Boston 461 656 42.5
9 8 Philadelphia 467 650 39.4
10 10 Atlanta 402 575 42.9
Source: Oxford Economics
Related Stories
Market Data | May 12, 2020
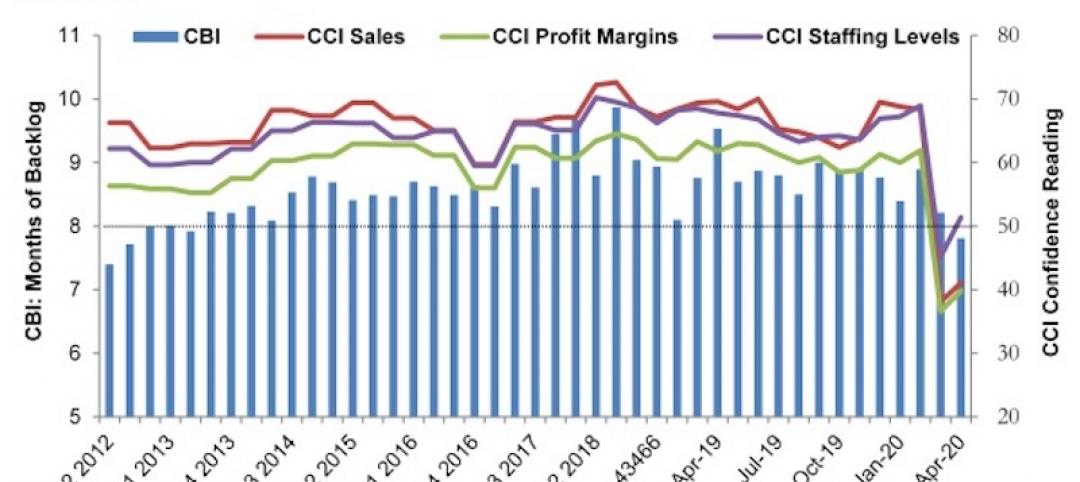
ABC’s Construction Backlog Indicator falls in April; Contractor Confidence rebounds from historic lows
Nonresidential construction backlog is down 0.4 months compared to the March 2020 ABC survey and 1.7 months from April 2019.

Market Data | May 12, 2020
6 must reads for the AEC industry today: May 12, 2020
A 13-point plan to reduce coronavirus deaths in nursing homes and Bjarke Ingels discusses building on Mars.

Market Data | May 11, 2020
Interest in eSports is booming amid COVID-19
The industry has proved largely immune to the COVID-19 pandemic due to its prompt transition into online formats and sudden spike in interest from traditional sports organizations.

Market Data | May 11, 2020
6 must reads for the AEC industry today: May 11, 2020
Nashville residential tower will rise 416 feet and the construction industry loses 975,000 jobs.

Market Data | May 8, 2020
Construction industry loses 975,000 jobs in April as new association survey shows deteriorating demand for construction projects
Association partner Procore also releases near real-time construction data measuring impacts of coronavirus as association calls for new measures.

Market Data | May 8, 2020
7 must reads for the AEC industry today: May 8, 2020
The death of the office and Colorado's first multifamily project to receive WELL Precertification.

Market Data | May 7, 2020
5 must reads for the AEC industry today: May 7, 2020
5 memory care communities with a strong sense of mission and making jobsites safer in the COVID-19 world.

Market Data | May 6, 2020
6 must reads for the AEC industry today: May 6, 2020
5 questions engineers will ask after COVID-19 and coronavirus threatens push for denser housing.

Market Data | May 5, 2020
5 must reads for the AEC industry today: May 5, 2020
A new temporary hospital pops up in N.J., and apartment firms' reactivation plans begin to take shape.

Market Data | May 4, 2020
6 must reads for the AEC industry today: May 4, 2020
How working from home is influencing design and is this the end of the open office?


