


The U.S. Energy Information Administration has posted preliminary results from its periodic Commercial Buildings Energy Consumption survey. Data for the project were collected in 2012 and detailed analyses of energy consumption will be released beginning next spring. The project includes buildings >1,000 sf that devote more than half of their floorspace to activity that is not residential, manufacturing, industrial, or agricultural.
The preliminary results from the Commercial Buildings Energy Consumption Survey (CBECS) show that there were 5.6 million commercial buildings in the United States in 2012, comprising 87.4 billion square feet of floorspace. This represents a 14% increase in the number of buildings and a 22% increase in floorspace since 2003, the last year for which CBECS results are available.
The preliminary data can be found in this summary table of building counts and total square footage by building size category, principal building activity, year of construction category, Census region, and Census division. The first tab provides the estimates; the second tab on the table provides relative standard errors (RSEs) for the estimates.
For comparison, there is a similar summary table from the 2003 CBECS. Other file formats for the same table can be accessed from the 2003 CBECS data page.
The size, use, vintage, and geographic region of a building are among the key determinants that influence its energy use. Subsequent releases will show more detailed characteristics and crosstabulations among key categories. This is the first release of many reports and data releases expected for the 2012 CBECS; these preliminary tables provide a first look at the building stock and the attributes that drive commercial energy use.
Trends – 1979 to 2012: Growth in building size outpaces increases in building stock
Since the first CBECS was conducted in 1979 to the current 2012 CBECS, the number of buildings has increased from 3.8 million to 5.6 million, and the amount of commercial floorspace has increased from 51 billion to 87 billion square feet.

HOW DOES EIA PRODUCE RELIABLE RESULTS FROM A SAMPLE SURVEY?
The CBECS is a national sample survey. See How Were Buildings Selected for the 2012 CBECS? for an overview of the sampling process. After the sample was selected, preparations for the interviewing phase began. In April 2013, about 250 field interviewers were trained to visit buildings across the United States and recruit respondents knowledgeable about energy use in the buildings. After recruiting a respondent at a building, the field interviewer’s job was to conduct an interview on a laptop computer asking questions about the building’s structure, use, energy equipment, and energy use. Between April and November 2013, interviews were conducted in-person or by telephone at over 6,500 buildings nationwide. Because every building had a chance to be selected and that chance is known, a sample weight can be assigned to each case. The resulting dataset is representative of the entire U.S. commercial building population.
Principal building activities: The most prevalent building types account for the majority of the total buildings and floorspace, while the building types with the largest average buildings are less common in the building stock
The commercial building sector is characterized by diversity. The 2012 survey identified more than 100 subcategories of building activity, which are aggregated into the 14 principal building activities shown in the summary table and in the figures below. CBECS includes buildings as small and singular in activity as a freestanding bank or fast food restaurant, to buildings as large and complex as an office building with hundreds of tenants or a major airport terminal. CBECS also includes vacant buildings; some vacant buildings use energy, either for maintenance purposes or because a small amount of space is still used in the building1.

Among the general building activities, lodging, education, and health care are the largest buildings, on average. The health care category's average is greatly affected by the size of inpatient health care buildings (i.e., hospitals), which have an average size of 247,700 square feet per building, compared to outpatient health care buildings, which have an average size of 12,100 square feet.

Figure 4 tracks changes in the building stock over the past 10 years by comparing the number of buildings for each principal building activity from 2003 to 2012. The highest percent of growth was in vacant buildings and other types of buildings, which includes buildings such as airplane hangars, laboratories and data centers. Warehouses, food service buildings, public assembly, and office buildings also increased between 2003 and 2012, while food sales buildings (e.g., grocery and convenience stores) showed a decrease,2 and mercantile (retail and malls) showed a decrease, although it is not statistically significant. Because CBECS is a sample survey, each estimate has sampling error associated with it, which should be considered when comparing estimates. See What is an RSE? and Estimation of Standard Errors for more information.

Size of buildings: Although there are relatively few very large buildings (over 100,000 square feet of floorspace), they account for more than one-third of total commercial building floorspace
Commercial buildings are often depicted showing a skyline of towering buildings. However, the vast majority of commercial buildings are relatively small. Just less than half of buildings are 5,000 square feet in size or smaller, and nearly three-fourths are 10,000 square feet or smaller. The median building size is 5,100 square feet (i.e., half the buildings are larger than this and half are smaller), while the average size is 15,700 square feet. The average is larger than the median because of the influence of a small number of very large buildings; buildings over 100,000 square feet make up only about 2% of the building count but about 35% of the total floorspace.

Year constructed: The commercial building stock is middle-aged, and newer buildings are larger than older ones
Commercial buildings remain in use for many decades. Although about 12% of commercial buildings (comprising 14% of commercial floorspace) were built in the past 10 years, the commercial building stock is still fairly old, with about half of all buildings constructed at least 35 years ago. However, in the existing building stock, there are more buildings built in the 2000s than buildings built prior to 1946.

Newer buildings tend to be larger than older buildings. The average building size for those constructed before 1960 is 12,000 square feet; buildings constructed between 1960 and 1999 average 16,300 square feet; and buildings constructed in the 2000s average 19,100 square feet. The differences between these average building sizes are statistically significant.

Census region and division (see map): The South has the most commercial buildings, but the Northeast has the largest commercial buildings
The South Census region, the most populous of the four Census regions, has the largest percentage of commercial buildings and commercial floorspace, with about 40% of both total buildings and floorspace. The Midwest and West regions each account for more than one-fifth of commercial buildings and floorspace.

Buildings in the Northeast region are, on average, 4,000 to 5,000 square feet larger than buildings in the other regions. The Northeast region includes the Middle Atlantic division (New York, Pennsylvania, and New Jersey), where buildings average 22,400 square feet.

Footnote
1 CBECS principal building activity is defined as the activity occupying the most floorspace. Respondents are first asked if there is one activity that occupies 75% or more of the floorspace. If not, CBECS collects the top three building activities and their corresponding percents and the principal activity is assigned as the one comprising the most floorspace.
2 Estimates for number of food sales buildings can be somewhat misleading because grocery stores and convenience stores are often part of strip malls and therefore included in the "Enclosed and strip malls" category in CBECS. "Enclosed and strip malls" is a subcategory of "Mercantile" and is shown in the summary table.
Specific questions on this product may be directed to Joelle Michaels.
Related Stories

| Oct 12, 2010
Cuyahoga County Soldiers’ and Sailors’ Monument, Cleveland, Ohio
27th Annual Reconstruction Awards—Gold Award. The Cuyahoga County Soldiers’ and Sailors’ Monument was dedicated on the Fourth of July, 1894, to honor the memory of the more than 9,000 Cuyahoga County veterans of the Civil War.

| Oct 12, 2010
Building 13 Naval Station, Great Lakes, Ill.
27th Annual Reconstruction Awards—Gold Award. Designed by Chicago architect Jarvis Hunt and constructed in 1903, Building 13 is one of 39 structures within the Great Lakes Historic District at Naval Station Great Lakes, Ill.

| Oct 12, 2010
Full Steam Ahead for Sustainable Power Plant
An innovative restoration turns a historic but inoperable coal-burning steam plant into a modern, energy-efficient marvel at Duke University.
| Oct 12, 2010
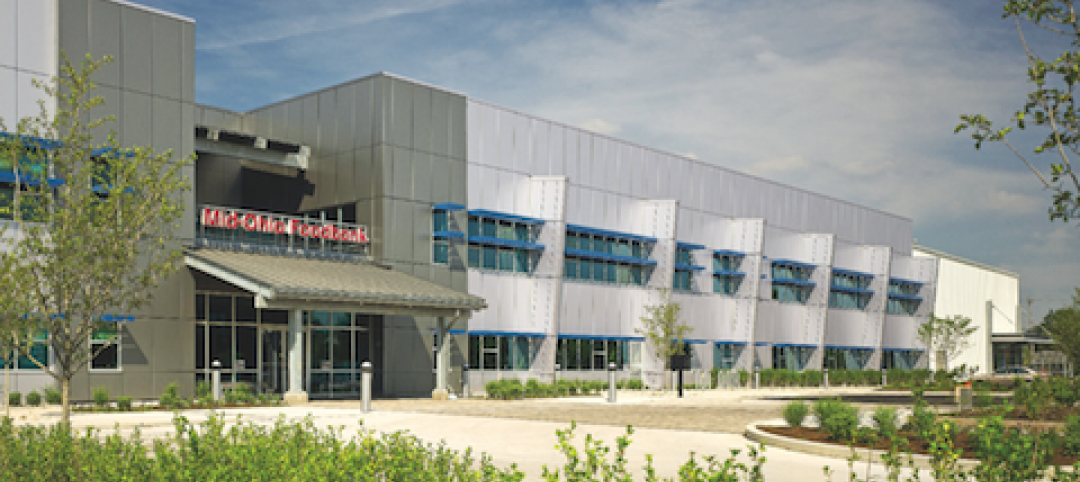
From ‘Plain Box’ to Community Asset
The Mid-Ohio Foodbank helps provide 55,000 meals a day to the hungry. Who would guess that it was once a nondescript mattress factory?
| Oct 11, 2010
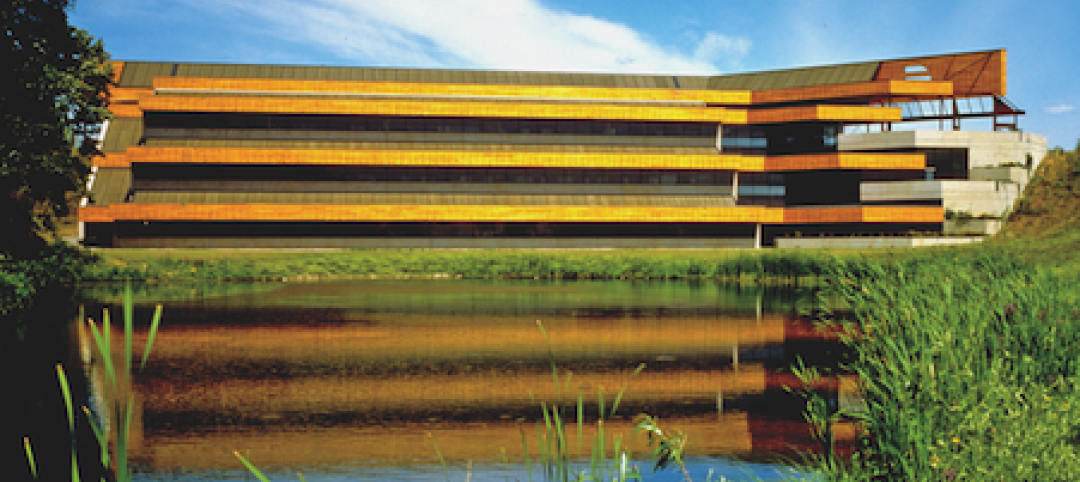
HGA wins 25-Year Award from AIA Minnesota
HGA Architects and Engineers won a 25-Year Award from AIA Minnesota for the Willow Lake Laboratory.
| Oct 11, 2010
MBMA Releases Fire Resistance Design Guide for metal building systems
The Metal Building Manufacturers Association (MBMA) announces the release of the 2010 Fire Resistance Design Guide for Metal Building Systems. The guide provides building owners, architects, engineers, specifiers, fire marshals, building code officials, contractors, product vendors, builders and metal building manufacturers information on how to effectively meet fire resistance requirements of a project with metal building systems.
| Oct 11, 2010
Rhode Island is the first state to adopt IGCC
Rhode Island is the first state to adopt the International Green Construction Code (IGCC). The Rhode Island Green Buildings Act identifies the IGCC as an equivalent standard in compliance with requirements that all public agency major facility projects be designed and constructed as green buildings. The Rules and Regulations to implement the Act take effect in October 2010.

| Oct 8, 2010
Union Bank’S San Diego HQ awarded LEED Gold
Union Bank’s San Diego headquarters building located at 530 B Street has been awarded LEED Gold certification from the Green Building Certification Institute under the standards established by the U.S. Green Building Council. Gold status was awarded to six buildings across the United States in the most recent certification and Union Bank’s San Diego headquarters building is one of only two in California.

| Oct 6, 2010
Windows Keep Green Goals in View
The DOE's National Renewable Energy Laboratory has almost 600 window openings, and yet it's targeting LEED Platinum, net-zero energy use, and 50% improvement over ASHRAE 90.1. How the window ‘problem’ is part of the solution.
| Oct 6, 2010
From grocery store to culinary school
A former West Philadelphia supermarket is moving up the food chain, transitioning from grocery store to the Center for Culinary Enterprise, a business culinary training school.


