


Step aside New York and L.A., The Atlantic’s CityLab finds that not all design jobs have these two trendy hotspots as their epicenters.
CityLab Editor at Large Richard Florida worked together with occupational data provided by the labor market data and research firm EMSI to identify geographic clusters of the design sector – architects and landscape architects; commercial and industrial designers, graphic designers, fashion designers, interior designer, and others. His analysis included both designers working for firms and self-employed freelancers.
Around 625,000 Americans are employed in the design sector, a decline of about 12,000 since the Great Recession.
The analyst zoomed into specific metro areas (those with more than a million people) and mapped out the number of workers in the design sector, median wages and regional share of designers for the largest 51 U.S. metros.
Florida developed a stat named the location quotient (LQ), which measures the concentration of a given occupation in a metro area to its concentration across the country. Hence, an LQ of 1 indicates the occupation’s share matches the national average, an LQ of 2 is double that, and so on.
Though the concentration of fashion designers expectedly falls on New York first and L.A. second, Florida’s findings indicate four clusters of design fields concentrated in a city other than those two, and here they are:
Detroit – Commercial and Industrial Designers

Commercial and industrial designers that design manufactured products like cars, toys and appliances are centered in the rust belt, with Detroit’s LQ leading at 5.7.
Seattle – Architects

With an LQ of 2.42, Seattle was far above New York, which came in tenth, and Los Angeles, which came in twentieth.
Minneapolis – Graphic Designers

The Twin Cities tops the list of graphic designers with an LQ of 1.7., which Florida thinks is “driven by its long-standing strength as a center for marketing and advertising.”
San Francisco – Self-employed Designers

It’s only natural that San Francisco, the hub of start-ups, would also invite a lot of independent, self-employed designers of all fields. With an LQ of 2.06, the City by the Bay is ahead of Los Angeles and New York, with tech hubs San Jose, San Diego and Austin between them.
Visit CityLab to learn more and view maps of the United States with bubbles showing the concentration of workers in the design sector.
Related Stories

Big Data | Jan 5, 2018
In the age of data-driven design, has POE’s time finally come?
At a time when research- and data-based methods are playing a larger role in architecture, there remains a surprisingly scant amount of post-occupancy research. But that’s starting to change.

Multifamily Housing | Jan 4, 2018
Shigeru Ban’s mass timber tower in Vancouver gets city approval
The 232-foot-tall Terrace House luxury condo development will be the tallest hybrid wood structure in North America.
Architects | Jan 4, 2018
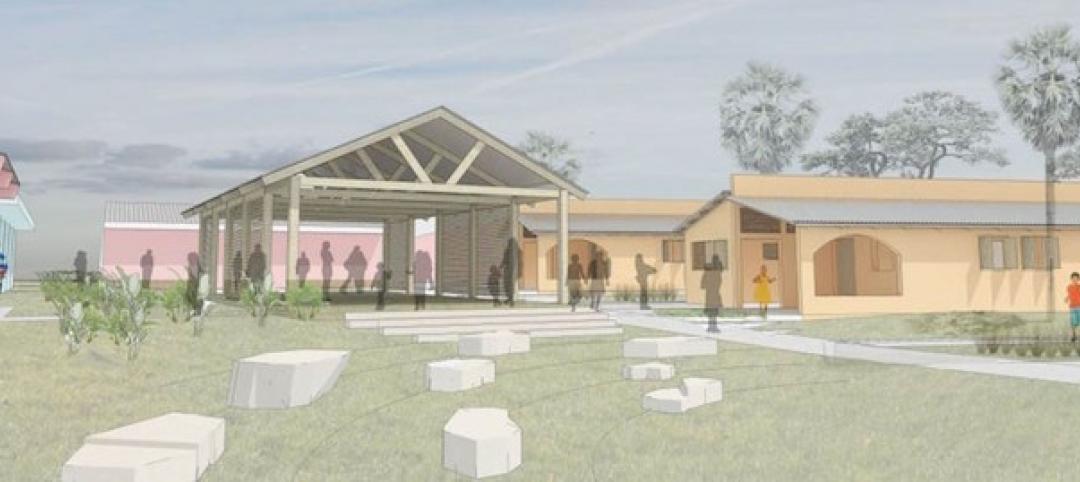
Integrated design for children and housing
Homelessness is an issue affecting millions around the globe.

Sponsored | | Jan 3, 2018
4 networking strategies to grow your business
Follow these networking strategies to grow your architectural business with the work that you want.

BD+C University Course | Jan 2, 2018
The art and science of rendering: Visualization that sells architecture [AIA course]
3D artist Ramy Hanna offers guidelines and tricks-of-the-trade to ensure that project artwork is a stunning depiction of the unbuilt space.
Green | Dec 22, 2017
Green builders can use ‘big data’ to make design decisions
More and more, green project teams are relying on publicly available “external datasets” to prioritize sustainable design decisions, says sustainability consultant Adele Houghton.

Reconstruction & Renovation | Dec 21, 2017
Interactive map includes detailed information on historic New York City buildings
The New York City Landmarks Preservation Commission launched a new, enhanced version of its interactive map, Discover NYC Landmarks.

High-rise Construction | Dec 20, 2017
Another record year for high-rise construction
More than 140 skyscrapers were completed across the globe this year, including 15 supertall towers.

Game Changers | Dec 20, 2017
Urban farms can help plant seeds for cities’ growth around them
Urban farms have been impacting cities’ agribusiness—and, on some cases, their redevelopment—for decades.
 reported the November ABI score was 55.0, up from a score of 51.7 in the previous month. Photo: Pixabay")
Market Data | Dec 20, 2017
Architecture billings upturn shows broad strength
The American Institute of Architects (AIA) reported the November ABI score was 55.0, up from a score of 51.7 in the previous month.


