

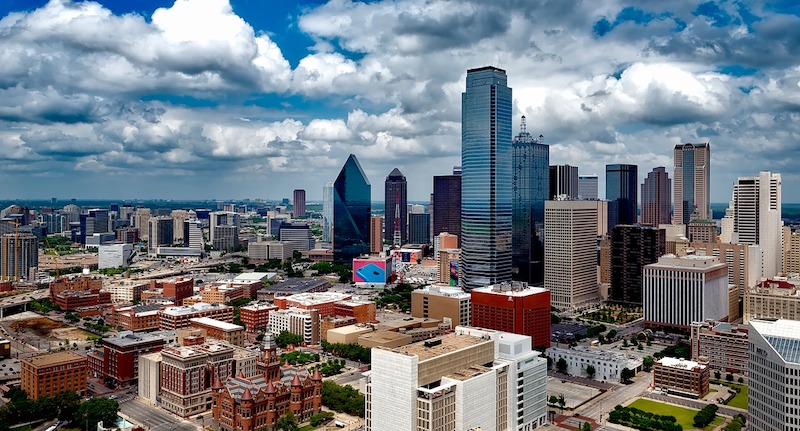
According to a new study from COMMERCIALCafé, Dallas leads the way as the city in the United States with the highest potential for urban infill development. The results are based on the total developable vacant land available in each city’s central business district.
Dallas has a total of 86.37 acres of developable land in its central business district, 11 more than the second place city of Las Vegas, which has 75.16 acres. Austin (70.72), San Antonio (42.39), and Phoenix (31.03) round out the top five.
An additional COMMERCIALCafé survey asked individuals living in the top 25 cities what they want to see built in their city’s urban core and what they felt the city needs most. Affordable housing was the most common answer for what a given respondent’s city needs at 82%. Housing and parks were the most desired improvements at 77%. Additionally, walkability was the top infrastructure improvement highlighted in all 25 cities.
Click here for the full study.

Related Stories

Market Data | Aug 24, 2021
July construction employment lags pre-pandemic peak in 36 states
Delta variant of coronavirus threatens to hold down further gains.

Market Data | Aug 17, 2021
Demand for design activity continues to expand
The ABI score for July was 54.6.

Market Data | Aug 12, 2021
Steep rise in producer prices for construction materials and services continues in July.
The producer price index for new nonresidential construction rose 4.4% over the past 12 months.

Market Data | Aug 6, 2021
Construction industry adds 11,000 jobs in July
Nonresidential sector trails overall recovery.

Market Data | Aug 2, 2021
Nonresidential construction spending falls again in June
The fall was driven by a big drop in funding for highway and street construction and other public work.

Market Data | Jul 29, 2021
Outlook for construction spending improves with the upturn in the economy
The strongest design sector performers for the remainder of this year are expected to be health care facilities.

Market Data | Jul 29, 2021
Construction employment lags or matches pre-pandemic level in 101 metro areas despite housing boom
Eighty metro areas had lower construction employment in June 2021 than February 2020.

Market Data | Jul 28, 2021
Marriott has the largest construction pipeline of U.S. franchise companies in Q2‘21
472 new hotels with 59,034 rooms opened across the United States during the first half of 2021.

Market Data | Jul 27, 2021
New York leads the U.S. hotel construction pipeline at the close of Q2‘21
Many hotel owners, developers, and management groups have used the operational downtime, caused by COVID-19’s impact on operating performance, as an opportunity to upgrade and renovate their hotels and/or redefine their hotels with a brand conversion.

Market Data | Jul 26, 2021
U.S. construction pipeline continues along the road to recovery
During the first and second quarters of 2021, the U.S. opened 472 new hotels with 59,034 rooms.


