

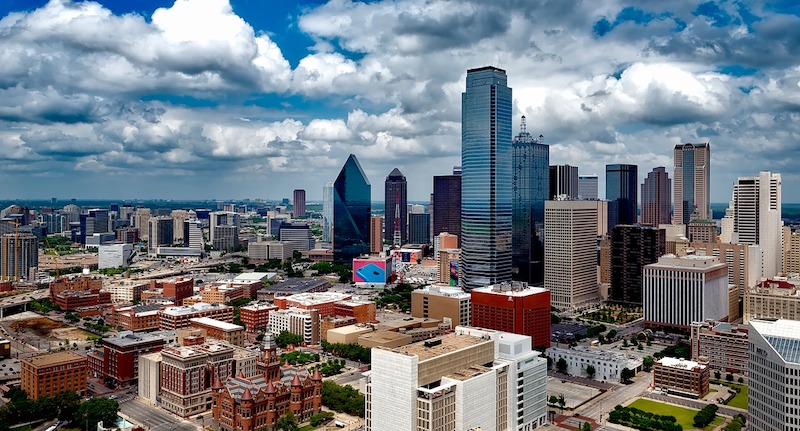
According to a new study from COMMERCIALCafé, Dallas leads the way as the city in the United States with the highest potential for urban infill development. The results are based on the total developable vacant land available in each city’s central business district.
Dallas has a total of 86.37 acres of developable land in its central business district, 11 more than the second place city of Las Vegas, which has 75.16 acres. Austin (70.72), San Antonio (42.39), and Phoenix (31.03) round out the top five.
An additional COMMERCIALCafé survey asked individuals living in the top 25 cities what they want to see built in their city’s urban core and what they felt the city needs most. Affordable housing was the most common answer for what a given respondent’s city needs at 82%. Housing and parks were the most desired improvements at 77%. Additionally, walkability was the top infrastructure improvement highlighted in all 25 cities.
Click here for the full study.

Related Stories

Market Data | Sep 28, 2021
Design-Build projects should continue to take bigger shares of construction spending pie over next five years
FMI’s new study finds collaboration and creativity are major reasons why owners and AEC firms prefer this delivery method.

Market Data | Sep 22, 2021
Architecture billings continue to increase
The ABI score for August was 55.6, up from July’s score of 54.6.

Market Data | Sep 20, 2021
August construction employment lags pre-pandemic peak in 39 states
The coronavirus delta variant and supply problems hold back recovery.

Market Data | Sep 15, 2021
ABC’s Construction Backlog Indicator plummets in August; Contractor Confidence down
ABC’s Construction Confidence Index readings for sales, profit margins and staffing levels all fell modestly in August.

Market Data | Sep 7, 2021
Construction sheds 3,000 jobs in August
Gains are limited to homebuilding as other contractors struggle to fill both craft and salaried positions.

Market Data | Sep 3, 2021
Construction workforce shortages reach pre-pandemic levels
Coronavirus continues to impact projects and disrupt supply chains.

Multifamily Housing | Sep 1, 2021
Top 10 outdoor amenities at multifamily housing developments for 2021
Fire pits, lounge areas, and covered parking are the most common outdoor amenities at multifamily housing developments, according to new research from Multifamily Design+Construction.

Market Data | Sep 1, 2021
Construction spending posts small increase in July
Coronavirus, soaring costs, and supply disruptions threaten to erase further gains.

Market Data | Sep 1, 2021
Bradley Corp. survey finds office workers taking coronavirus precautions
Due to the rise in new strains of the virus, 70% of office workers have implemented a more rigorous handwashing regimen versus 59% of the general population.

Market Data | Aug 31, 2021
Three out of four metro areas add construction jobs from July 2020 to July 2021
COVID, rising costs, and supply chain woes may stall gains.


