

Nationally, the average cost to build out an office is $196.49/sf. But after taking into account the average landlord-provided tenant-improvement allowance of $43.61/sf, the out-of-pocket cost for tenants is $152.88/sf, according to JLL’s new U.S. Fit Out Guide.
The report combines fitout costs and tenant improvement allowances to paint a comprehensive picture of what companies can expect to pay out of pocket for an office buildout across the nation. It also details the most- and least-expensive markets for fitouts.
Coming out on top as the most expensive market to build out an office is Silicon Valley, Calif., with an out-of-pocket cost of $199.22. The most affordable market: Washington, D.C., at $103.88.
“It’s no surprise that the Northwest continues to be the most expensive region for office builds,” says Mason Mularoni, Senior Research Analyst, JLL Project and Development Services. Southern cities claimed six out of the 10 most affordable markets.
Due to the range of landlord-provided tenant improvement packages, some cities that made the top lists were pretty unexpected.
 Silicon Valley, Calif., is the most expensive market for office fitout projects, with an average out-of-pocket cost of $199.22/sf, according to JLL.
Washington, D.C.: most affordable. Often topping most-expensive lists, the District of Columbia is officially the most inexpensive market to build out an office space. As the federal government, contractors, and law firms continue to consolidate, slightly below-average buildout costs are offset by record-high concession packages from landlords who are desperate to get tenants into the exploding mass of available space.
Detroit: eighth most expensive. Once on the brink of financial collapse, the Motor City is being reinvigorated by an eager tech community. Startups, investors, and outside firms are attracted to the Motor City’s resolve to bounce back.
But Detroit isn’t in the clear just yet. Due to above-average buildout costs and minimal TI packages, the city swings in as one of the top out-of-pocket cost markets.
Los Angeles: sixth most affordable market to build out an office. New leasing activity has been nourished by the convergence of media, technology, and entertainment. The tech sector in particular has shown a preference for creative buildouts. LA’s enormous TI packages are tied with Washington, D.C., for largest in the nation, offering an affordable option in the notoriously expensive state.
Long Island, N.Y.: third most expensive, beating out traditional frontrunner New York City. When it comes to building costs alone, New York City tops the list. But substantial TI packages in the city allow Long Island to slide ahead in out-of-pocket costs, holding its own against the expensive Northern California cities.
Seattle: seventh most affordable. Although the Northwest region tops the most expensive list, Seattle is the exception to the rule. Technology continues to be the primary factor of the city, and significant growth is occurring from local companies as well as from tenants migrating from the Bay Area.
The second-largest TI package average across the nation enables Seattle to hold down seventh place in most-affordable-city honors.
Related Stories

Market Data | May 4, 2020
The Los Angeles market continue to lead the U.S. hotel construction pipeline at the close of the first quarter of 2020
Nationally, under construction project counts hit a new all-time high with 1,819 projects with 243,100 rooms.

Market Data | May 1, 2020
Nonresidential construction spending declines in March as pandemic halts projects
Group warns loan threats are hurting relief program.
Market Data | May 1, 2020
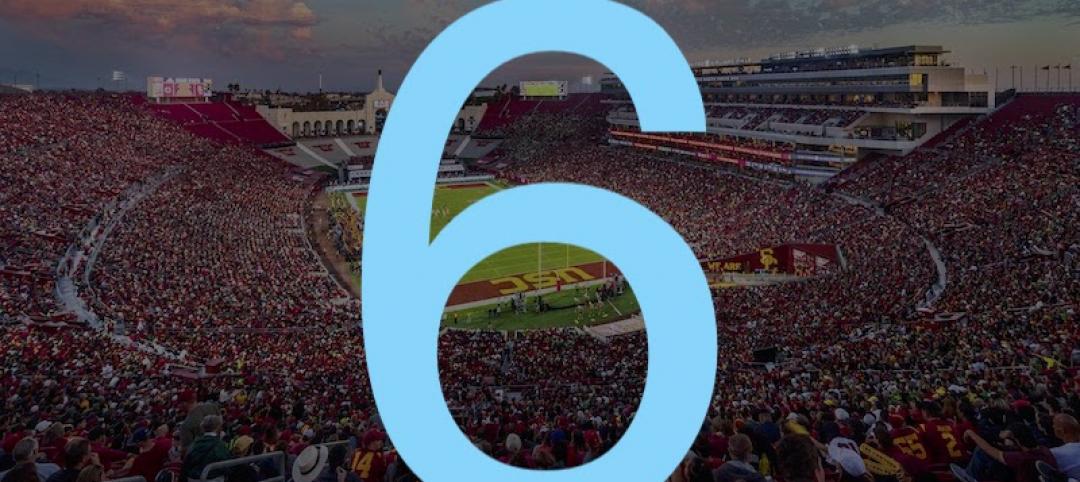
6 must reads for the AEC industry today: May 1, 2020
DLR Group completes LA Memorial Coliseum renovation and over 50% of department stores in malls predicted to close by 2021.

Market Data | Apr 30, 2020
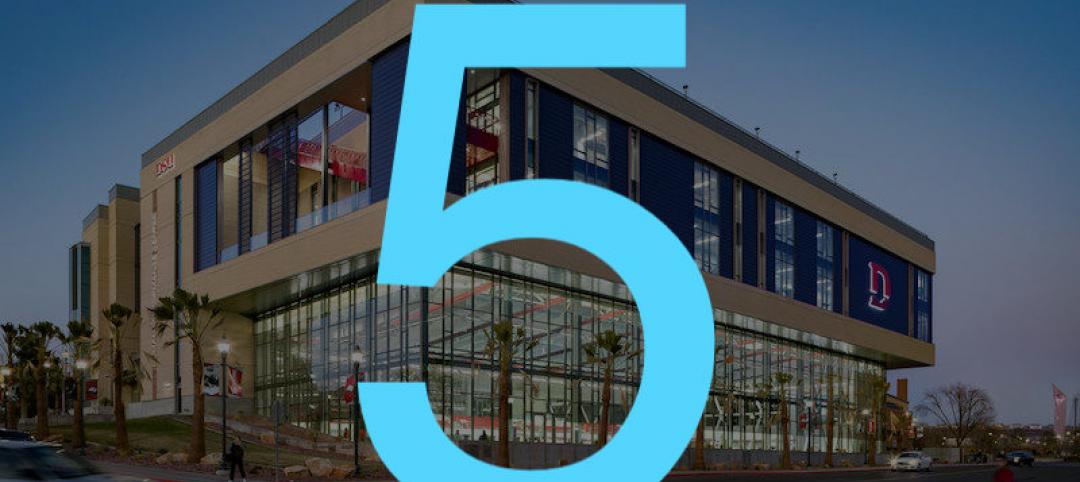
5 must reads for the AEC industry today: April 30, 2020
College programs help prepare students for careers in the construction industry and a national movement to cancel May rent takes shape.

Market Data | Apr 30, 2020
The U.S. Hotel Construction pipeline continued to expand year-over-year despite COVID-19 in the first quarter of 2020
Many open or temporarily closed hotels have already begun or are in the planning stages of renovating and repositioning their assets while occupancy is low or non-existent.
Market Data | Apr 29, 2020
5 must reads for the AEC industry today: April 29, 2020
A new Human performance Center and Construction employment declines in 99 metro areas.

Market Data | Apr 29, 2020
Construction employment declines in 99 metro areas in March from 2019
Industry officials call for new state and federal funding to add jobs.

Market Data | Apr 28, 2020
5 must reads for the AEC industry today: April 28, 2020
A virtual 'city-forest' to help solve population density challenges and planning for life in cities after the pandemic.

Market Data | Apr 27, 2020
5 must reads for the AEC industry today: April 27, 2020
Colleges begin building campus eSports arenas and PCL Construction rolls out portable coronavirus testing centers.

Market Data | Apr 24, 2020
6 must reads for the AEC industry today: April 24, 2020
Take a virtual tour of Frank Lloyd Wright's Robie House and Construction Contractor Confidence plummets.


