

Nationally, the average cost to build out an office is $196.49/sf. But after taking into account the average landlord-provided tenant-improvement allowance of $43.61/sf, the out-of-pocket cost for tenants is $152.88/sf, according to JLL’s new U.S. Fit Out Guide.
The report combines fitout costs and tenant improvement allowances to paint a comprehensive picture of what companies can expect to pay out of pocket for an office buildout across the nation. It also details the most- and least-expensive markets for fitouts.
Coming out on top as the most expensive market to build out an office is Silicon Valley, Calif., with an out-of-pocket cost of $199.22. The most affordable market: Washington, D.C., at $103.88.
“It’s no surprise that the Northwest continues to be the most expensive region for office builds,” says Mason Mularoni, Senior Research Analyst, JLL Project and Development Services. Southern cities claimed six out of the 10 most affordable markets.
Due to the range of landlord-provided tenant improvement packages, some cities that made the top lists were pretty unexpected.
 Silicon Valley, Calif., is the most expensive market for office fitout projects, with an average out-of-pocket cost of $199.22/sf, according to JLL.
Washington, D.C.: most affordable. Often topping most-expensive lists, the District of Columbia is officially the most inexpensive market to build out an office space. As the federal government, contractors, and law firms continue to consolidate, slightly below-average buildout costs are offset by record-high concession packages from landlords who are desperate to get tenants into the exploding mass of available space.
Detroit: eighth most expensive. Once on the brink of financial collapse, the Motor City is being reinvigorated by an eager tech community. Startups, investors, and outside firms are attracted to the Motor City’s resolve to bounce back.
But Detroit isn’t in the clear just yet. Due to above-average buildout costs and minimal TI packages, the city swings in as one of the top out-of-pocket cost markets.
Los Angeles: sixth most affordable market to build out an office. New leasing activity has been nourished by the convergence of media, technology, and entertainment. The tech sector in particular has shown a preference for creative buildouts. LA’s enormous TI packages are tied with Washington, D.C., for largest in the nation, offering an affordable option in the notoriously expensive state.
Long Island, N.Y.: third most expensive, beating out traditional frontrunner New York City. When it comes to building costs alone, New York City tops the list. But substantial TI packages in the city allow Long Island to slide ahead in out-of-pocket costs, holding its own against the expensive Northern California cities.
Seattle: seventh most affordable. Although the Northwest region tops the most expensive list, Seattle is the exception to the rule. Technology continues to be the primary factor of the city, and significant growth is occurring from local companies as well as from tenants migrating from the Bay Area.
The second-largest TI package average across the nation enables Seattle to hold down seventh place in most-affordable-city honors.
Related Stories
Market Data | May 12, 2020
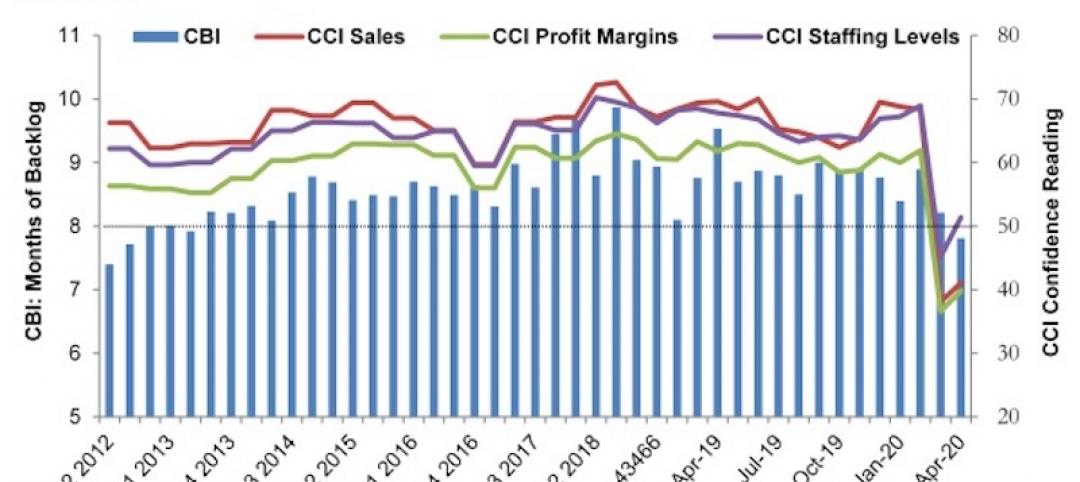
ABC’s Construction Backlog Indicator falls in April; Contractor Confidence rebounds from historic lows
Nonresidential construction backlog is down 0.4 months compared to the March 2020 ABC survey and 1.7 months from April 2019.

Market Data | May 12, 2020
6 must reads for the AEC industry today: May 12, 2020
A 13-point plan to reduce coronavirus deaths in nursing homes and Bjarke Ingels discusses building on Mars.

Market Data | May 11, 2020
Interest in eSports is booming amid COVID-19
The industry has proved largely immune to the COVID-19 pandemic due to its prompt transition into online formats and sudden spike in interest from traditional sports organizations.

Market Data | May 11, 2020
6 must reads for the AEC industry today: May 11, 2020
Nashville residential tower will rise 416 feet and the construction industry loses 975,000 jobs.

Market Data | May 8, 2020
Construction industry loses 975,000 jobs in April as new association survey shows deteriorating demand for construction projects
Association partner Procore also releases near real-time construction data measuring impacts of coronavirus as association calls for new measures.

Market Data | May 8, 2020
7 must reads for the AEC industry today: May 8, 2020
The death of the office and Colorado's first multifamily project to receive WELL Precertification.

Market Data | May 7, 2020
5 must reads for the AEC industry today: May 7, 2020
5 memory care communities with a strong sense of mission and making jobsites safer in the COVID-19 world.

Market Data | May 6, 2020
6 must reads for the AEC industry today: May 6, 2020
5 questions engineers will ask after COVID-19 and coronavirus threatens push for denser housing.

Market Data | May 5, 2020
5 must reads for the AEC industry today: May 5, 2020
A new temporary hospital pops up in N.J., and apartment firms' reactivation plans begin to take shape.

Market Data | May 4, 2020
6 must reads for the AEC industry today: May 4, 2020
How working from home is influencing design and is this the end of the open office?


