


In 2009, we met with Senior Facility Managers of four U.S. national laboratories to discuss a major limitation in the way they summarized their capital needs. As with most large organizations, they expressed capital needs in terms of deferred maintenance projects—things that needed to be fixed as determined by condition assessment (inspection or prescribed schedule). To put these needs in perspective, they computed a facility condition index (FCI), which is the ratio of deferred maintenance (D.M) costs to the replacement value of a building or portfolio.
Several years later, following the acquisition of Whitestone Research by CBRE Inc., it quickly became clear that major healthcare organizations around the world oftentimes employ a similar FCI based approach to their capital planning and prioritization decisions.
FACILITY CONDITION INDEX BREAKDOWN
According to a well-known scale developed initially for educational facilities in 1991, a facility is considered in poor condition if its FCI exceeds 90%. The shortcomings of the FCI approach are well-known, as results are not easily compared with alternative condition assessment approaches, and it does not contemplate methodologies for determining replacement values. These choices can become highly political for an organization that uses, as many do, the FCI as a key policy metric.
The basic concern of the laboratory facility managers was that the FCI did not represent the true condition of the facility in terms of safety, security, mission relevance, and other criteria that actually guide their decisions. FCI is also not a forecast or leading indicator that demonstrates consequences of alternative actions. These concerns led to a series of small projects that would eventually define a new approach to summarizing facility condition and prioritizing capital expenditures.
The new method, Risk Scanning, meets three requirements identified in our original meeting. The process must not rely on expensive inspections, must incorporate multiple (customizable) criteria, and the outcomes must be expressed as a simple monetary value.
This approach has universal applicability for laboratories and for large, corporate occupiers. In addition, we have found this approach to be particularly relevant for healthcare organizations today, given the extraordinary economic and regulatory pressures that have become a reality for the industry.
RISK SCANNING
Risk Scanning assumes that buildings or other assets can be reduced to an inventory of components (roof, HVAC equipment, plumbing fixtures, etc.). Each component has a “survivor” curve that relates its age to the likelihood of its failure in the future, little different than an actuarial calculation for an insurance policy. And each component, should it fail, could have consequences for the building operation. Below, Figure 1 illustrates how this data could be used as a simple sort by probability of failure, consequence of failure, or replacement cost.
Figure 1
A more useful view of this data combines knowledge of the probability of failure and the potential consequences as the Risk Facility Managers implicitly consider when scheduling repairs. For example, a new light bulb in a closet would be low risk (low likelihood of failure, low impact on safety, security, mission, etc.), while a roof or electrical panel, far beyond their expected service life would be a high risk. Individual component risk ratings can be aggregated into risk maps by building, consequence type, or aggregated at the portfolio level.
Another example is a risk scan of a data center built in 1980, as shown in Figure 2. Risk is summarized by three consequences or threats of failure – mission, productivity and safety. The “Loss Intensity” is the measure (low, medium, high) of the impact of failure. Each cell in the tables is the sum of the replacement value of each component. For instance, in the first table there are high risk (red) components with replacement values totaling $374,210.
Figure 2: Dashboard showing risk by consequence
One way to represent overall risk is to sum across the individual tables in Figure 2, by risk category (red = high, yellow = moderate, green = low) to produce a single risk column, as shown in Figure 3. This shows that the costs to replace components rated high risk in 2015 for any reason (mission, productivity, or safety) were $2,349,315. Note that some components are high risk for multiple reasons.
Figure 3: Risk Column
The calculation of the column can be modified for different purposes. The ratings from the dashboard could be weighted to reflect management priorities. The likelihood of failure, and consequent migration of risk ratings, could be estimated for a range of years, as shown for the period 2015-2019.
COMPARING THE FCI WITH RISK SCANNING
The data center example provides a useful comparison of the output from a simple condition assessment with the additional data provided by Risk Scanning.
A conventional facility condition assessment using a life cycle cost model indicated that 75 components had exceeded their service life. The costs of replacing these would be $4,771,159. Considering this amount to be deferred maintenance (D.M.), the FCI would be 5% (given $100 million replacement value). This would be summarized as a building in “fair” condition.
Figure 4
A Risk Scan of the component inventory indicates that 13 components are at high risk, and the costs of replacing these would be $2,349,315. This is less than half the costs of replacements by a simple service life-assessment. An FCI based on high risk components would be 2.2%, indicating a building in “good” condition.
In this case, with the additional information provided by Risk Scanning, the facility would be considered in better condition than with the simple condition assessment. Moreover, the risk scan would provide a rating for all components—including those not yet considered as deferred maintenance—as a basis for anticipating future needs and prioritization.
CONCLUSION
The Risk Scanning approach uses well-known risk analytics applied to pre-existing facility data to provide a richer view of facility condition more consistent with actual management decision making. In practice, limited funding is directed to those repairs and replacements that address corporate priorities, such as safety, security, and mission achievement. For healthcare systems, this approach can provide critical insight for decision-making about capital deployment where actionable criteria are not established or where data is limited.
About the Authors
Peter Lufkin is Senior Managing Director and Luca Romani is Senior Analyst with CBRE Whitestone.
Related Stories

| Sep 13, 2010
Second Time Around
A Building Team preserves the historic facade of a Broadway theater en route to creating the first green playhouse on the Great White Way.
| Sep 13, 2010
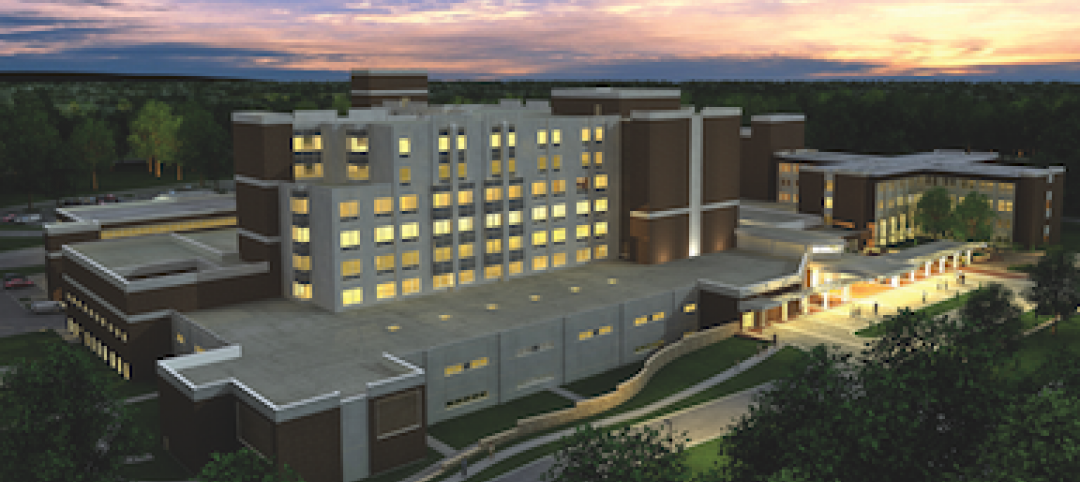
Palos Community Hospital plans upgrades, expansion
A laboratory, pharmacy, critical care unit, perioperative services, and 192 new patient beds are part of Palos (Ill.) Community Hospital's 617,500-sf expansion and renovation.

| Sep 13, 2010
China's largest single-phase hospital planned for Shanghai
RTKL's Los Angles office is designing the Shanghai Changzheng New Pudong Hospital, which will be the largest new hospital built in China in a single phase.

| Sep 13, 2010
Richmond living/learning complex targets LEED Silver
The 162,000-sf living/learning complex includes a residence hall with 122 units for 459 students with a study center on the ground level and communal and study spaces on each of the residential levels. The project is targeting LEED Silver.
| Sep 13, 2010
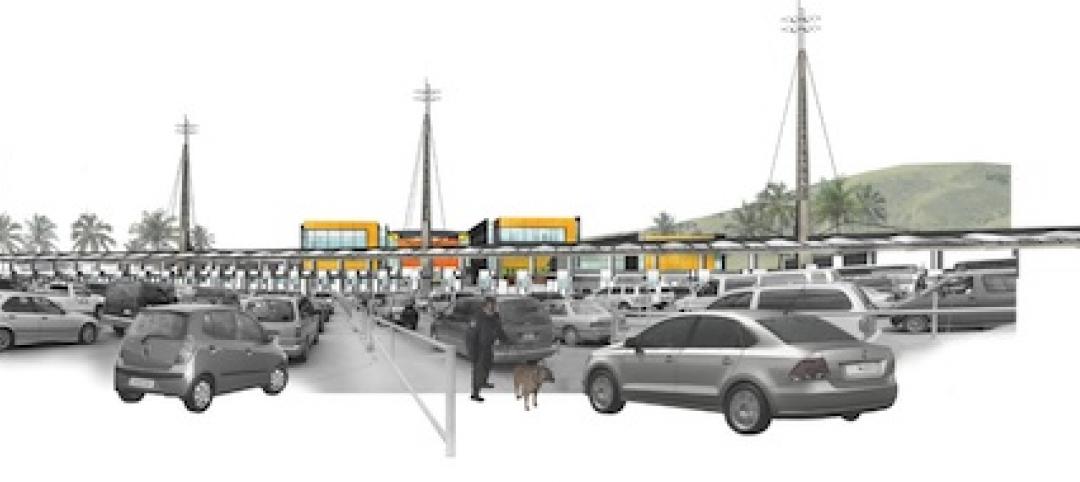
World's busiest land port also to be its greenest
A larger, more efficient, and supergreen border crossing facility is planned for the San Ysidro (Calif.) Port of Entry to better handle the more than 100,000 people who cross the U.S.-Mexico border there each day.

| Sep 13, 2010
Triple-LEED for Engineering Firm's HQ
With more than 250 LEED projects in the works, Enermodal Engineering is Canada's most prolific green building consulting firm. In 2007, with the firm outgrowing its home office in Kitchener, Ont., the decision was made go all out with a new green building. The goal: triple Platinum for New Construction, Commercial Interiors, and Existing Buildings: O&M.

| Sep 13, 2010
Stadium Scores Big with Cowboys' Fans
Jerry Jones, controversial billionaire owner of the Dallas Cowboys, wanted the team's new stadium in Arlington, Texas, to really amp up the fan experience. The organization spent $1.2 billion building a massive three-million-sf arena that seats 80,000 (with room for another 20,000) and has more than 300 private suites, some at field level-a first for an NFL stadium.

| Sep 13, 2010
'A Model for the Entire Industry'
How a university and its Building Team forged a relationship with 'the toughest building authority in the country' to bring a replacement hospital in early and under budget.
| Sep 13, 2010
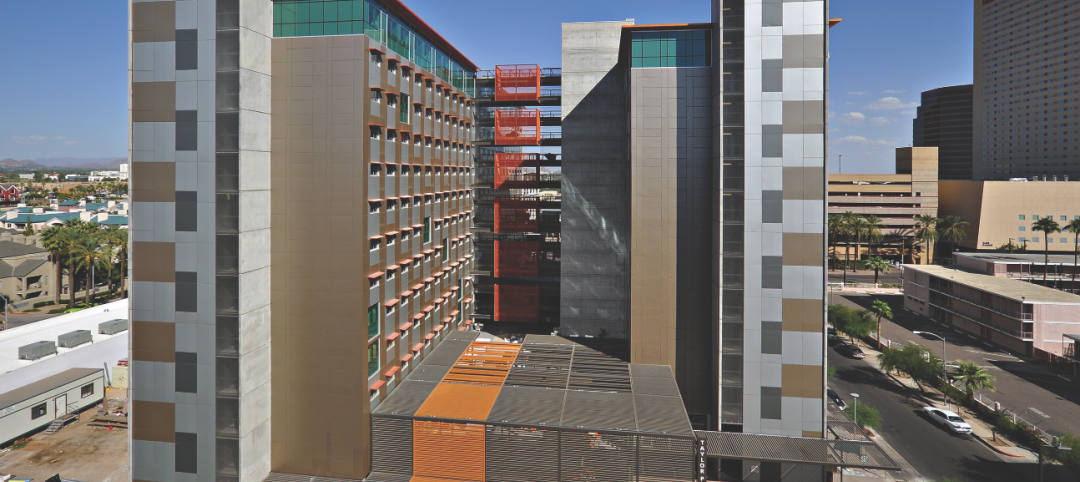
Committed to the Core
How a forward-looking city government, a growth-minded university, a developer with vision, and a determined Building Team are breathing life into downtown Phoenix.


