


In 2009, we met with Senior Facility Managers of four U.S. national laboratories to discuss a major limitation in the way they summarized their capital needs. As with most large organizations, they expressed capital needs in terms of deferred maintenance projects—things that needed to be fixed as determined by condition assessment (inspection or prescribed schedule). To put these needs in perspective, they computed a facility condition index (FCI), which is the ratio of deferred maintenance (D.M) costs to the replacement value of a building or portfolio.
Several years later, following the acquisition of Whitestone Research by CBRE Inc., it quickly became clear that major healthcare organizations around the world oftentimes employ a similar FCI based approach to their capital planning and prioritization decisions.
FACILITY CONDITION INDEX BREAKDOWN
According to a well-known scale developed initially for educational facilities in 1991, a facility is considered in poor condition if its FCI exceeds 90%. The shortcomings of the FCI approach are well-known, as results are not easily compared with alternative condition assessment approaches, and it does not contemplate methodologies for determining replacement values. These choices can become highly political for an organization that uses, as many do, the FCI as a key policy metric.
The basic concern of the laboratory facility managers was that the FCI did not represent the true condition of the facility in terms of safety, security, mission relevance, and other criteria that actually guide their decisions. FCI is also not a forecast or leading indicator that demonstrates consequences of alternative actions. These concerns led to a series of small projects that would eventually define a new approach to summarizing facility condition and prioritizing capital expenditures.
The new method, Risk Scanning, meets three requirements identified in our original meeting. The process must not rely on expensive inspections, must incorporate multiple (customizable) criteria, and the outcomes must be expressed as a simple monetary value.
This approach has universal applicability for laboratories and for large, corporate occupiers. In addition, we have found this approach to be particularly relevant for healthcare organizations today, given the extraordinary economic and regulatory pressures that have become a reality for the industry.
RISK SCANNING
Risk Scanning assumes that buildings or other assets can be reduced to an inventory of components (roof, HVAC equipment, plumbing fixtures, etc.). Each component has a “survivor” curve that relates its age to the likelihood of its failure in the future, little different than an actuarial calculation for an insurance policy. And each component, should it fail, could have consequences for the building operation. Below, Figure 1 illustrates how this data could be used as a simple sort by probability of failure, consequence of failure, or replacement cost.
Figure 1
A more useful view of this data combines knowledge of the probability of failure and the potential consequences as the Risk Facility Managers implicitly consider when scheduling repairs. For example, a new light bulb in a closet would be low risk (low likelihood of failure, low impact on safety, security, mission, etc.), while a roof or electrical panel, far beyond their expected service life would be a high risk. Individual component risk ratings can be aggregated into risk maps by building, consequence type, or aggregated at the portfolio level.
Another example is a risk scan of a data center built in 1980, as shown in Figure 2. Risk is summarized by three consequences or threats of failure – mission, productivity and safety. The “Loss Intensity” is the measure (low, medium, high) of the impact of failure. Each cell in the tables is the sum of the replacement value of each component. For instance, in the first table there are high risk (red) components with replacement values totaling $374,210.
Figure 2: Dashboard showing risk by consequence
One way to represent overall risk is to sum across the individual tables in Figure 2, by risk category (red = high, yellow = moderate, green = low) to produce a single risk column, as shown in Figure 3. This shows that the costs to replace components rated high risk in 2015 for any reason (mission, productivity, or safety) were $2,349,315. Note that some components are high risk for multiple reasons.
Figure 3: Risk Column
The calculation of the column can be modified for different purposes. The ratings from the dashboard could be weighted to reflect management priorities. The likelihood of failure, and consequent migration of risk ratings, could be estimated for a range of years, as shown for the period 2015-2019.
COMPARING THE FCI WITH RISK SCANNING
The data center example provides a useful comparison of the output from a simple condition assessment with the additional data provided by Risk Scanning.
A conventional facility condition assessment using a life cycle cost model indicated that 75 components had exceeded their service life. The costs of replacing these would be $4,771,159. Considering this amount to be deferred maintenance (D.M.), the FCI would be 5% (given $100 million replacement value). This would be summarized as a building in “fair” condition.
Figure 4
A Risk Scan of the component inventory indicates that 13 components are at high risk, and the costs of replacing these would be $2,349,315. This is less than half the costs of replacements by a simple service life-assessment. An FCI based on high risk components would be 2.2%, indicating a building in “good” condition.
In this case, with the additional information provided by Risk Scanning, the facility would be considered in better condition than with the simple condition assessment. Moreover, the risk scan would provide a rating for all components—including those not yet considered as deferred maintenance—as a basis for anticipating future needs and prioritization.
CONCLUSION
The Risk Scanning approach uses well-known risk analytics applied to pre-existing facility data to provide a richer view of facility condition more consistent with actual management decision making. In practice, limited funding is directed to those repairs and replacements that address corporate priorities, such as safety, security, and mission achievement. For healthcare systems, this approach can provide critical insight for decision-making about capital deployment where actionable criteria are not established or where data is limited.
About the Authors
Peter Lufkin is Senior Managing Director and Luca Romani is Senior Analyst with CBRE Whitestone.
Related Stories

| Oct 12, 2010
Owen Hall, Michigan State University, East Lansing, Mich.
27th Annual Reconstruction Awards—Silver Award. Officials at Michigan State University’s East Lansing Campus were concerned that Owen Hall, a mid-20th-century residence facility, was no longer attracting much interest from its target audience, graduate and international students.

| Oct 12, 2010
Gartner Auditorium, Cleveland Museum of Art
27th Annual Reconstruction Awards—Silver Award. Gartner Auditorium was originally designed by Marcel Breuer and completed, in 1971, as part of his Education Wing at the Cleveland Museum of Art. Despite that lofty provenance, the Gartner was never a perfect music venue.

| Oct 12, 2010
Cell and Genome Sciences Building, Farmington, Conn.
27th Annual Reconstruction Awards—Silver Award. Administrators at the University of Connecticut Health Center in Farmington didn’t think much of the 1970s building they planned to turn into the school’s Cell and Genome Sciences Building. It’s not that the former toxicology research facility was in such terrible shape, but the 117,800-sf structure had almost no windows and its interior was dark and chopped up.

| Oct 12, 2010
The Watch Factory, Waltham, Mass.
27th Annual Reconstruction Awards — Gold Award. When the Boston Watch Company opened its factory in 1854 on the banks of the Charles River in Waltham, Mass., the area was far enough away from the dust, dirt, and grime of Boston to safely assemble delicate watch parts.
| Oct 12, 2010
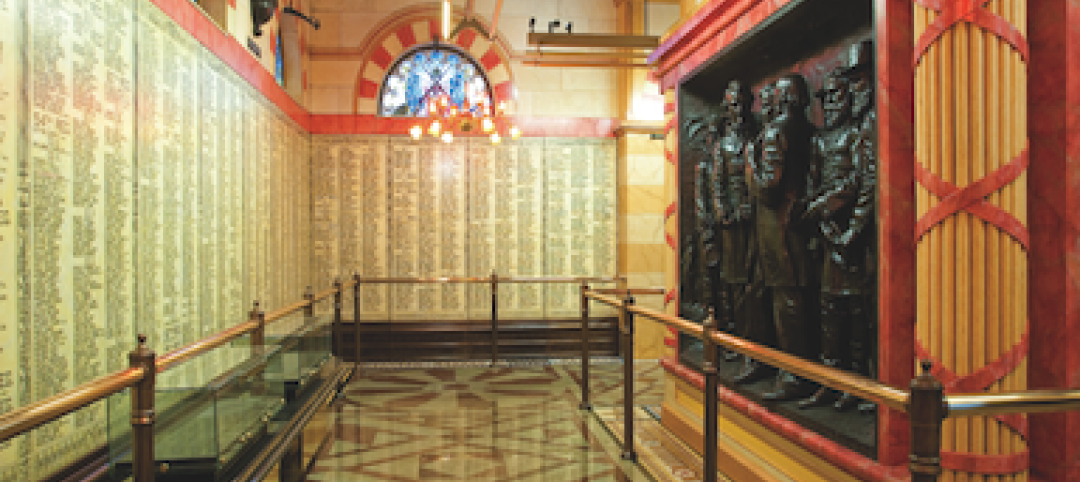
Cuyahoga County Soldiers’ and Sailors’ Monument, Cleveland, Ohio
27th Annual Reconstruction Awards—Gold Award. The Cuyahoga County Soldiers’ and Sailors’ Monument was dedicated on the Fourth of July, 1894, to honor the memory of the more than 9,000 Cuyahoga County veterans of the Civil War.

| Oct 12, 2010
Building 13 Naval Station, Great Lakes, Ill.
27th Annual Reconstruction Awards—Gold Award. Designed by Chicago architect Jarvis Hunt and constructed in 1903, Building 13 is one of 39 structures within the Great Lakes Historic District at Naval Station Great Lakes, Ill.

| Oct 12, 2010
Full Steam Ahead for Sustainable Power Plant
An innovative restoration turns a historic but inoperable coal-burning steam plant into a modern, energy-efficient marvel at Duke University.
| Oct 12, 2010
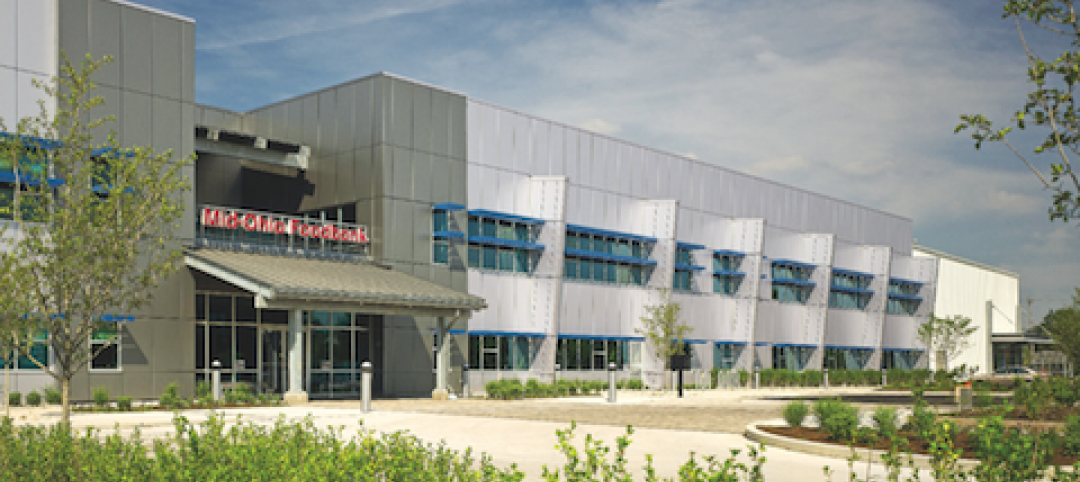
From ‘Plain Box’ to Community Asset
The Mid-Ohio Foodbank helps provide 55,000 meals a day to the hungry. Who would guess that it was once a nondescript mattress factory?

| Oct 11, 2010
HGA wins 25-Year Award from AIA Minnesota
HGA Architects and Engineers won a 25-Year Award from AIA Minnesota for the Willow Lake Laboratory.
| Oct 11, 2010
MBMA Releases Fire Resistance Design Guide for metal building systems
The Metal Building Manufacturers Association (MBMA) announces the release of the 2010 Fire Resistance Design Guide for Metal Building Systems. The guide provides building owners, architects, engineers, specifiers, fire marshals, building code officials, contractors, product vendors, builders and metal building manufacturers information on how to effectively meet fire resistance requirements of a project with metal building systems.


