


The Building Owners and Managers Association (BOMA) International has identified the most expensive commercial real estate markets in the U.S. The data is drawn from the 2011 Experience Exchange Report (EER), which provides an annual analysis of the office building operating income and expense data compiled across approximately 940 million square feet of commercial office space in more than 6,500 buildings in 278 different markets. The 2011 report is based on operating income and expenses from 2010.
The most expensive U.S. cities, based on total rental income, include:
- New York, N.Y., $48.27 per square foot (psf)
- Washington, D.C., $42.63 psf
- San Mateo, Calif., $41.61 psf
- Santa Monica, Calif., $36.67 psf
- San Francisco, Calif., $34.86 psf
- Boston, Mass., $31.15 psf
- San Jose, Calif., $30.35 psf
- Los Angeles, Calif., $27.97 psf
- West Palm Beach, Fla., $27.71 psf
- Chicago, Ill., $25.20 psf
Total rental income includes rental income from office, retail, and other space, which includes storage areas. Amid the economic downturn in real estate markets, few markets demonstrated significant increases in rental income, suggesting that rental rates remain relatively stable and favorable for tenants seeking to pursue new leases or renegotiate existing ones. Among the most expensive cities, only New York and San Francisco showed increases in rental income.
Gauging most expensive cities on the basis of total operating and fixed expenses produces a slightly different list:
- New York, N.Y., $21.44 psf
- Washington, D.C., $16.86 psf
- Boston, Mass., $15.16 psf
- Morristown, N.J., $14.67 psf
- San Francisco, Calif., $14.43 psf
- Miami, Fla., $12.87 psf
- Santa Monica, Calif., $12.84 psf
- Plainfield, N.J., $12.83 psf
- Chicago, Ill. and Los Angeles, Calif., 12.49 psf
- Newark, N.J., $12.46 psf
Total operating expenses includes all expenses incurred to operate office buildings, including utilities, repairs/maintenance, cleaning, administrative, security and roads and grounds. Fixed expenses include real estate taxes, property taxes and insurance. In New York, average total operating plus fixed expenses were $21.44 per square foot (psf), while in Los Angeles, they averaged $12.96 psf. Operating expenses increased in most markets in the last year. Fixed expenses were volatile, which could be attributed in part to rising utility costs as well as rising real estate taxes. While many cash-constrained cities and municipalities are looking to real estate for tax revenue, many property owners are contesting tax assessments because asset values have decreased due to the economic downturn. BD+C
Related Stories

Architects | Sep 1, 2020
An evidenced-based approach to elevate the workplace experience
A new NBBJ report presents design concepts for providing people with opportunities to recharge and engage in the workplace.

K-12 Schools | Sep 1, 2020
The rise of inquiry-based learning in K-12 communities
Inquiry-based education offers a methodology that does not rely solely on the educator being the lead in all learning.

Giants 400 | Aug 28, 2020
2020 Giants 400 Report: Ranking the nation's largest architecture, engineering, and construction firms
The 2020 Giants 400 Report features more than 130 rankings across 25 building sectors and specialty categories.

Architects | Aug 27, 2020
Strategically planning your firm past the COVID-19 pandemic
As AEC firm leaders consider worst-case scenarios and explore possible solutions to surmount them, they learn to become nimble, quick, and ready to pivot as circumstances demand.

Digital Twin | Aug 27, 2020
The Weekly show: Digital twin technology and social equity in the AEC market
The August 27 episode of BD+C's "The Weekly" is available for viewing on demand.

Architects | Aug 26, 2020
We the People: Four steps for the architecture profession to build unity through design
Architect offers a 4-point manifesto to the design community to work for racial and social justice in the U.S. following the death of George Floyd.

Coronavirus | Aug 25, 2020
Video: 5 building sectors to watch amid COVID-19
RCLCO's Brad Hunter reveals the winners and non-winners of the U.S. real estate market during the coronavirus pandemic.
Architects | Aug 19, 2020
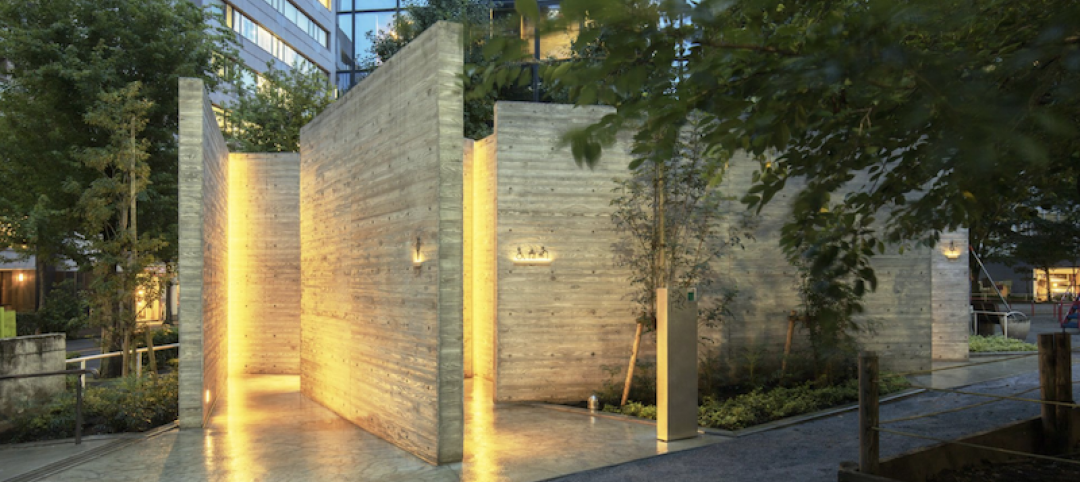
Japan’s Tokyo Toilet project looks to improve the perception of public restrooms
17 toilets throughout Shibuya will be redesigned as part of the project.
Architects | Aug 5, 2020
Final report: BD+C's 2020 Color Trends Report
This special research report from the editors of BD+C explores the leading trends and drivers related to the use of color on commercial, institutional, and multifamily building projects.

University Buildings | Aug 2, 2020
R&D hubs, modular-built hotels, and an award-winning student center on the August 6 “The Weekly”
R&D hubs, modular-built hotels, and an award-winning student center on the August 6 “The Weekly”


