


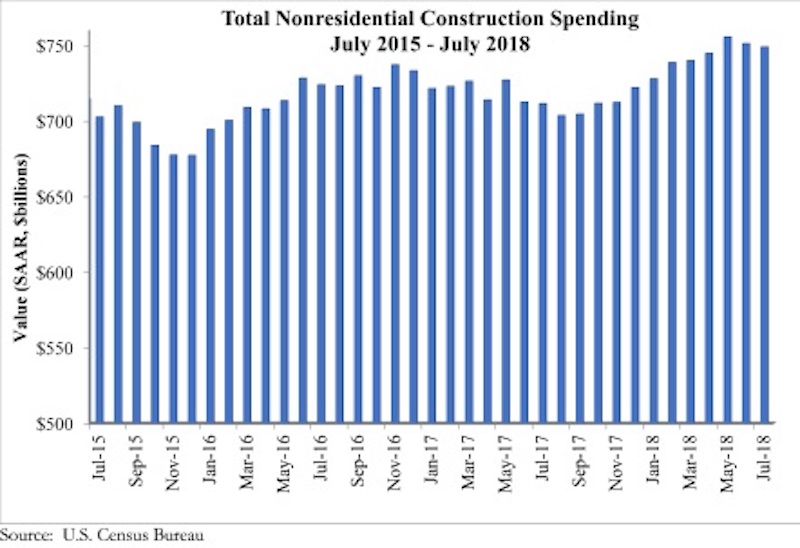
National nonresidential construction spending declined 0.3% in July, according to an Associated Builders and Contractors analysis of U.S. Census Bureau data recently released. Total nonresidential spending stood at $748.8 billion on a seasonally adjusted, annualized rate in July, an increase of 5.3% from the same time last year. Private nonresidential spending fell 1% in July, while public nonresidential spending expanded 0.7%.
“Construction spending dynamics have reversed almost completely during the past 12 to 18 months,” said ABC Chief Economist Anirban Basu. “Earlier in the cycle, private construction expanded briskly, driven in part by abundantly available financing at very low interest rates. While private construction volumes continue to be elevated, they are no longer expanding at quite the same rate. For instance, construction spending on lodging and office space barely budged for the month, while commercial construction, such as fulfillment and shopping centers, fell 3.3%.
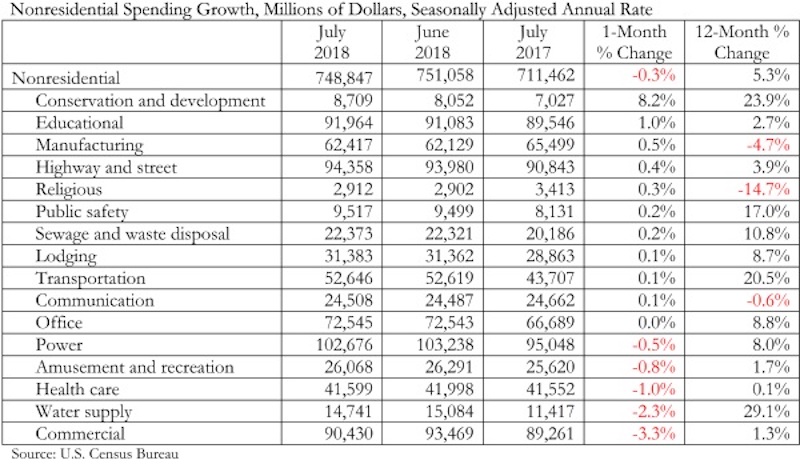
“By contrast, nonresidential construction segments associated with large public components, including conservation and development, education, highway and street, public safety, and sewage and waste disposal all experienced an uptick in spending in July,” said Basu. “Many states are now running budget surpluses for the first time in years, in part due to surging capital gains tax collections. One result is that more public projects are moving forward. As evidence, construction spending in the water supply category is up 29% on a year-over-year basis, conservation and development (e.g. flood control) by 24%, transportation by nearly 21%, public safety-related spending by 17% and sewage and waste disposal by 11%.
“The implication is that the economy’s strong performance is increasingly translating into infrastructure spending, even in the absence of a federal infrastructure package,” said Basu. “Given recent economic and financial market performance, there is every reason to believe that state and local government finances, though still fragile in many instances, will continue to improve. That strongly suggests public construction spending will continue to progress during the months ahead. In constrast, private construction spending growth is more likely to remain constrained for a number of reasons, including recent increases in private borrowing costs and concerns that segments in certain communities are now overbuilt or approaching overbuilt status.”
Related Stories

Market Data | Apr 6, 2017
Architecture marketing: 5 tools to measure success
We’ve identified five architecture marketing tools that will help your firm evaluate if it’s on the track to more leads, higher growth, and broader brand visibility.

Market Data | Apr 3, 2017
Public nonresidential construction spending rebounds; overall spending unchanged in February
The segment totaled $701.9 billion on a seasonally adjusted annualized rate for the month, marking the seventh consecutive month in which nonresidential spending sat above the $700 billion threshold.

Market Data | Mar 29, 2017
Contractor confidence ends 2016 down but still in positive territory
Although all three diffusion indices in the survey fell by more than five points they remain well above the threshold of 50, which signals that construction activity will continue to be one of the few significant drivers of economic growth.

Market Data | Mar 24, 2017
These are the most and least innovative states for 2017
Connecticut, Virginia, and Maryland are all in the top 10 most innovative states, but none of them were able to claim the number one spot.

Market Data | Mar 22, 2017
After a strong year, construction industry anxious about Washington’s proposed policy shifts
Impacts on labor and materials costs at issue, according to latest JLL report.

Market Data | Mar 22, 2017
Architecture Billings Index rebounds into positive territory
Business conditions projected to solidify moving into the spring and summer.

Market Data | Mar 15, 2017
ABC's Construction Backlog Indicator fell to end 2016
Contractors in each segment surveyed all saw lower backlog during the fourth quarter, with firms in the heavy industrial segment experiencing the largest drop.

Market Data | Feb 28, 2017
Leopardo’s 2017 Construction Economics Report shows year-over-year construction spending increase of 4.2%
The pace of growth was slower than in 2015, however.

Market Data | Feb 23, 2017
Entering 2017, architecture billings slip modestly
Despite minor slowdown in overall billings, commercial/ industrial and institutional sectors post strongest gains in over 12 months.

Market Data | Feb 16, 2017
How does your hospital stack up? Grumman/Butkus Associates 2016 Hospital Benchmarking Survey
Report examines electricity, fossil fuel, water/sewer, and carbon footprint.


