


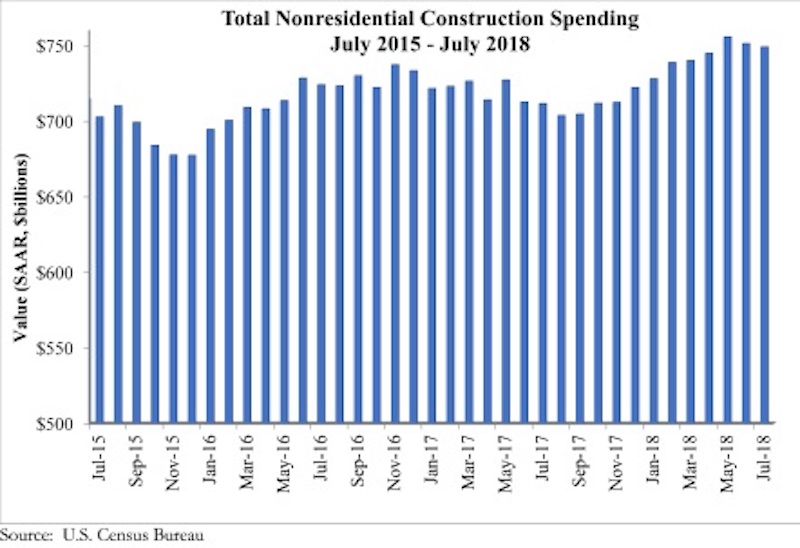
National nonresidential construction spending declined 0.3% in July, according to an Associated Builders and Contractors analysis of U.S. Census Bureau data recently released. Total nonresidential spending stood at $748.8 billion on a seasonally adjusted, annualized rate in July, an increase of 5.3% from the same time last year. Private nonresidential spending fell 1% in July, while public nonresidential spending expanded 0.7%.
“Construction spending dynamics have reversed almost completely during the past 12 to 18 months,” said ABC Chief Economist Anirban Basu. “Earlier in the cycle, private construction expanded briskly, driven in part by abundantly available financing at very low interest rates. While private construction volumes continue to be elevated, they are no longer expanding at quite the same rate. For instance, construction spending on lodging and office space barely budged for the month, while commercial construction, such as fulfillment and shopping centers, fell 3.3%.
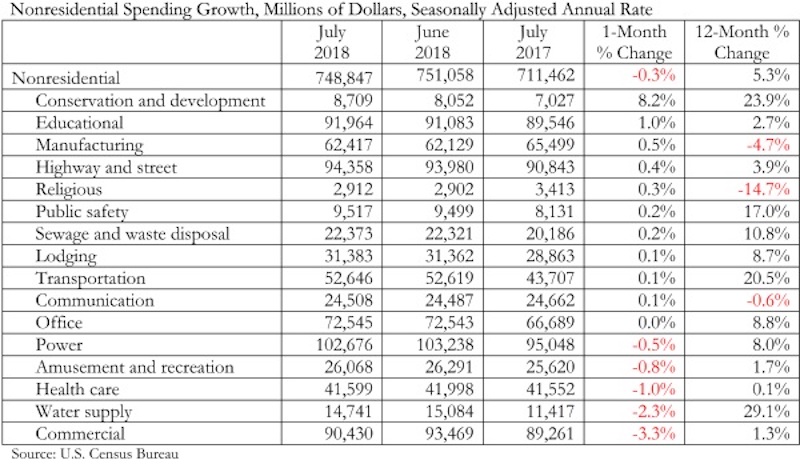
“By contrast, nonresidential construction segments associated with large public components, including conservation and development, education, highway and street, public safety, and sewage and waste disposal all experienced an uptick in spending in July,” said Basu. “Many states are now running budget surpluses for the first time in years, in part due to surging capital gains tax collections. One result is that more public projects are moving forward. As evidence, construction spending in the water supply category is up 29% on a year-over-year basis, conservation and development (e.g. flood control) by 24%, transportation by nearly 21%, public safety-related spending by 17% and sewage and waste disposal by 11%.
“The implication is that the economy’s strong performance is increasingly translating into infrastructure spending, even in the absence of a federal infrastructure package,” said Basu. “Given recent economic and financial market performance, there is every reason to believe that state and local government finances, though still fragile in many instances, will continue to improve. That strongly suggests public construction spending will continue to progress during the months ahead. In constrast, private construction spending growth is more likely to remain constrained for a number of reasons, including recent increases in private borrowing costs and concerns that segments in certain communities are now overbuilt or approaching overbuilt status.”
Related Stories

Green | Jan 31, 2018
U.S. Green Building Council releases annual top 10 states for LEED green building per capita
Massachusetts tops the list for the second year; New York, Hawaii and Illinois showcase leadership in geographically diverse locations.

Industry Research | Jan 30, 2018
AIA’s Kermit Baker: Five signs of an impending upturn in construction spending
Tax reform implications and rebuilding from natural disasters are among the reasons AIA’s Chief Economist is optimistic for 2018 and 2019.

Market Data | Jan 30, 2018
AIA Consensus Forecast: 4.0% growth for nonresidential construction spending in 2018
The commercial office and retail sectors will lead the way in 2018, with a strong bounce back for education and healthcare.

Market Data | Jan 29, 2018
Year-end data show economy expanded in 2017; Fixed investment surged in fourth quarter
The economy expanded at an annual rate of 2.6% during the fourth quarter of 2017.

Market Data | Jan 25, 2018
Renters are the majority in 42 U.S. cities
Over the past 10 years, the number of renters has increased by 23 million.

Market Data | Jan 24, 2018
HomeUnion names the most and least affordable rental housing markets
Chicago tops the list as the most affordable U.S. metro, while Oakland, Calif., is the most expensive rental market.

Market Data | Jan 12, 2018
Construction input prices inch down in December, Up YOY despite low inflation
Energy prices have been more volatile lately.

Market Data | Jan 4, 2018
Nonresidential construction spending ticks higher in November, down year-over-year
Despite the month-over-month expansion, nonresidential spending fell 1.3 percent from November 2016.

Contractors | Jan 4, 2018
Construction spending in a ‘mature’ period of incremental growth
Labor shortages are spiking wages. Materials costs are rising, too.
 reported the November ABI score was 55.0, up from a score of 51.7 in the previous month. Photo: Pixabay")
Market Data | Dec 20, 2017
Architecture billings upturn shows broad strength
The American Institute of Architects (AIA) reported the November ABI score was 55.0, up from a score of 51.7 in the previous month.


