


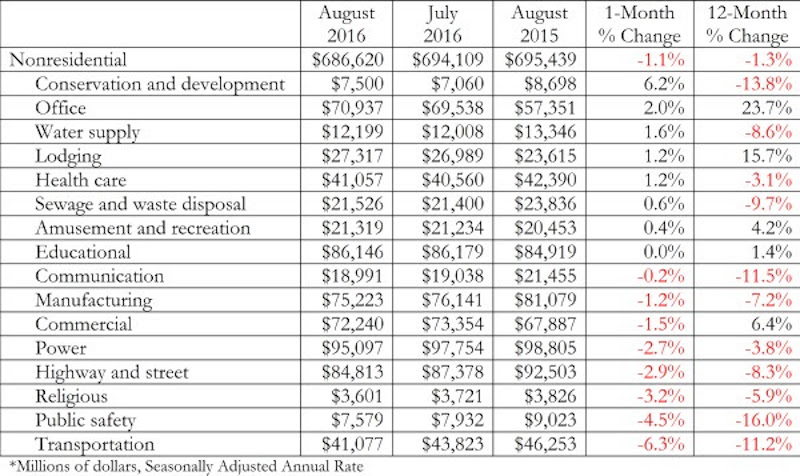
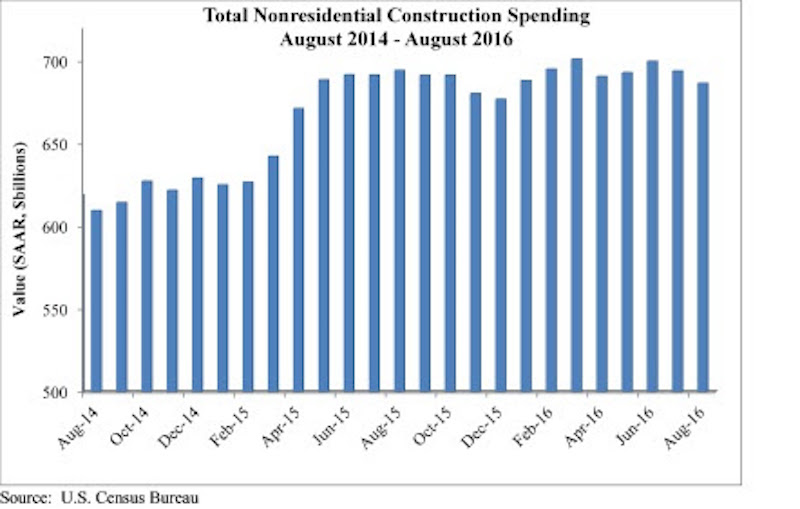
Nonresidential construction spending fell for a second consecutive month in August, according to analysis of U.S. Census Bureau released today by Associated Builders and Contractors (ABC). Nonresidential spending totaled $686.6 billion on a seasonally adjusted, annualized basis for the month, 1.1% lower than July’s total of $694.1 billion (revised down from $701 billion) and 1.3% below August 2015’s figure.
Private nonresidential construction spending fell just 0.4% for the month, while its public sector counterpart shrank 2%. Four of the five largest nonresidential subsectors—power, highway and street, commercial and manufacturing—combined to fall 2.2% on a monthly basis.
“While previous weak spending reports can almost completely be explained by diminished public construction spending, today’s report also revealed emerging weakness in private spending,” says ABC Chief Economist Anirban Basu.
However, spending has increased in some areas. Office-related construction increased 2% for the month and 24 percent on a year-over-year basis. Meanwhile, lodging-related construction spending increased 1.2% for the month and almost 16% year-over-year.
Other areas have underperformed. “Given the passage of a federal highway bill last year, one might have expected spending growth in the highway/street and transportation categories,” Basu says. “Those expectations have been unmet thus far. Transportation-related construction spending dipped by more than 6 percent in August and by more than 11 percent on a year-over-year basis. Highway and street spending is down by more than 8 percent on a year-ago basis, and was down nearly 3 percent for the month.”
Related Stories

Market Data | Sep 24, 2018
Hotel construction pipeline reaches record highs
There are 5,988 projects/1,133,017 rooms currently under construction worldwide.

Market Data | Sep 21, 2018
JLL fit out report portrays a hot but tenant-favorable office market
This year’s analysis draws from 2,800 projects.

Market Data | Sep 21, 2018
Mid-year forecast: No end in sight for growth cycle
The AIA Consensus Construction Forecast is projecting 4.7% growth in nonresidential construction spending in 2018.

Market Data | Sep 19, 2018
August architecture firm billings rebound as building investment spurt continues
Southern region, multifamily residential sector lead growth.

Market Data | Sep 18, 2018
Altus Group report reveals shifts in trade policy, technology, and financing are disrupting global real estate development industry
International trade uncertainty, widespread construction skills shortage creating perfect storm for escalating project costs; property development leaders split on potential impact of emerging technologies.


Market Data | Sep 17, 2018
ABC’s Construction Backlog Indicator hits a new high in second quarter of 2018
Backlog is up 12.2% from the first quarter and 14% compared to the same time last year.

Market Data | Sep 12, 2018
Construction material prices fall in August
Softwood lumber prices plummeted 9.6% in August yet are up 5% on a yearly basis (down from a 19.5% increase year-over-year in July).

Market Data | Sep 7, 2018
Safety risks in commercial construction industry exacerbated by workforce shortages
The report revealed 88% of contractors expect to feel at least a moderate impact from the workforce shortages in the next three years.

Market Data | Sep 5, 2018
Public nonresidential construction up in July
Private nonresidential spending fell 1% in July, while public nonresidential spending expanded 0.7%.


