


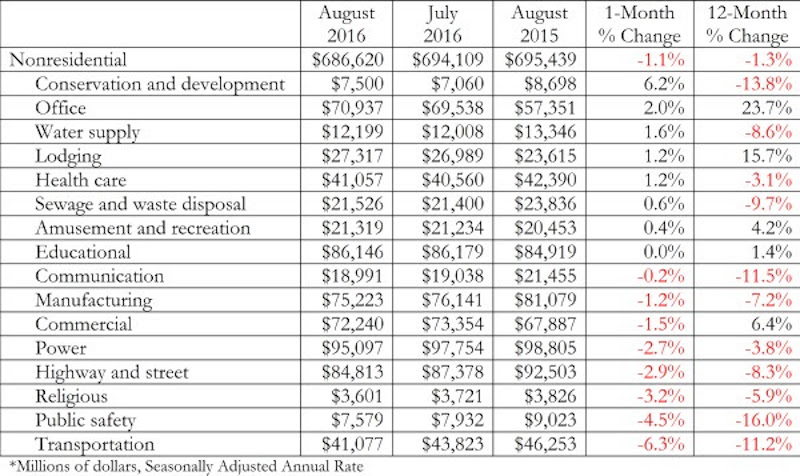
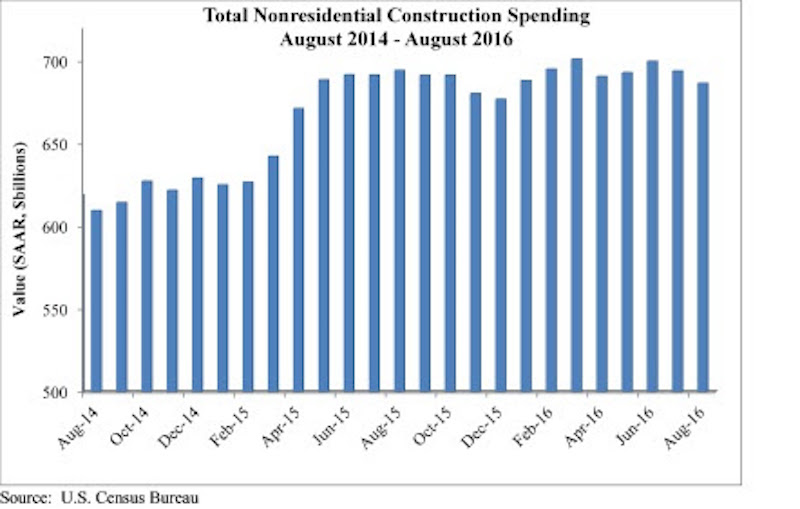
Nonresidential construction spending fell for a second consecutive month in August, according to analysis of U.S. Census Bureau released today by Associated Builders and Contractors (ABC). Nonresidential spending totaled $686.6 billion on a seasonally adjusted, annualized basis for the month, 1.1% lower than July’s total of $694.1 billion (revised down from $701 billion) and 1.3% below August 2015’s figure.
Private nonresidential construction spending fell just 0.4% for the month, while its public sector counterpart shrank 2%. Four of the five largest nonresidential subsectors—power, highway and street, commercial and manufacturing—combined to fall 2.2% on a monthly basis.
“While previous weak spending reports can almost completely be explained by diminished public construction spending, today’s report also revealed emerging weakness in private spending,” says ABC Chief Economist Anirban Basu.
However, spending has increased in some areas. Office-related construction increased 2% for the month and 24 percent on a year-over-year basis. Meanwhile, lodging-related construction spending increased 1.2% for the month and almost 16% year-over-year.
Other areas have underperformed. “Given the passage of a federal highway bill last year, one might have expected spending growth in the highway/street and transportation categories,” Basu says. “Those expectations have been unmet thus far. Transportation-related construction spending dipped by more than 6 percent in August and by more than 11 percent on a year-over-year basis. Highway and street spending is down by more than 8 percent on a year-ago basis, and was down nearly 3 percent for the month.”
Related Stories

Market Data | Apr 8, 2019
Engineering, construction spending to rise 3% in 2019: FMI outlook
Top-performing segments forecast in 2019 include transportation, public safety, and education.

Market Data | Apr 1, 2019
Nonresidential spending expands again in February
Private nonresidential spending fell 0.5% for the month and is only up 0.1% on a year-over-year basis.

Market Data | Mar 22, 2019
Construction contractors regain confidence in January 2019
Expectations for sales during the coming six-month period remained especially upbeat in January.

Market Data | Mar 21, 2019
Billings moderate in February following robust New Year
AIA’s Architecture Billings Index (ABI) score for February was 50.3, down from 55.3 in January.

Market Data | Mar 19, 2019
ABC’s Construction Backlog Indicator declines sharply in January 2019
The Construction Backlog Indicator contracted to 8.1 months during January 2019.

Market Data | Mar 15, 2019
2019 starts off with expansion in nonresidential spending
At a seasonally adjusted annualized rate, nonresidential spending totaled $762.5 billion for the month.

Market Data | Mar 14, 2019
Construction input prices rise for first time since October
Of the 11 construction subcategories, seven experienced price declines for the month.

Market Data | Mar 6, 2019
Global hotel construction pipeline hits record high at 2018 year-end
There are a record-high 6,352 hotel projects and 1.17 million rooms currently under construction worldwide.

Market Data | Feb 28, 2019
U.S. economic growth softens in final quarter of 2018
Year-over-year GDP growth was 3.1%, while average growth for 2018 was 2.9%.

Market Data | Feb 20, 2019
Strong start to 2019 for architecture billings
“The government shutdown affected architecture firms, but doesn’t appear to have created a slowdown in the profession,” said AIA Chief Economist Kermit Baker, Hon. AIA, PhD, in the latest ABI report.


