


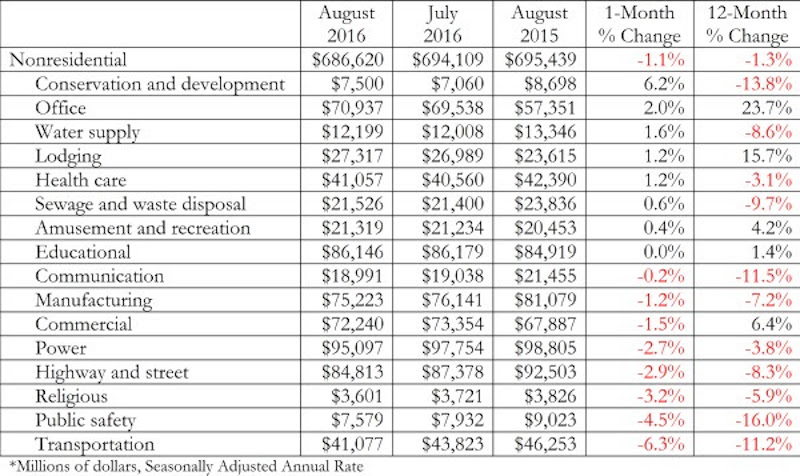
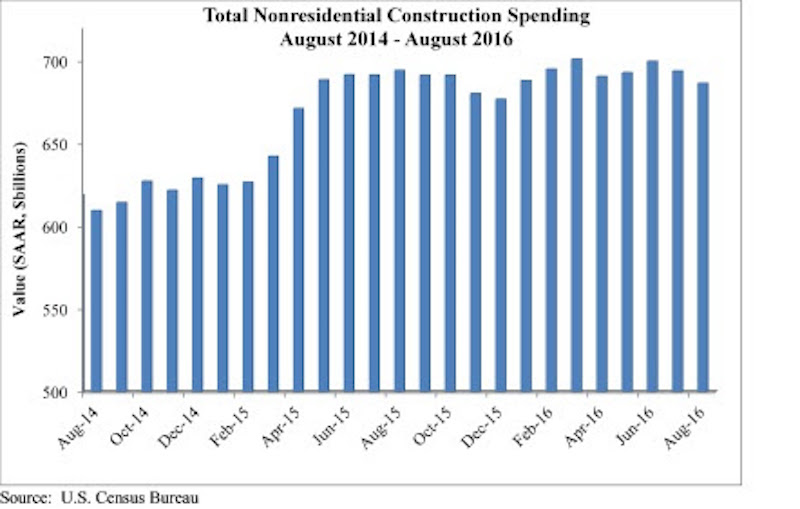
Nonresidential construction spending fell for a second consecutive month in August, according to analysis of U.S. Census Bureau released today by Associated Builders and Contractors (ABC). Nonresidential spending totaled $686.6 billion on a seasonally adjusted, annualized basis for the month, 1.1% lower than July’s total of $694.1 billion (revised down from $701 billion) and 1.3% below August 2015’s figure.
Private nonresidential construction spending fell just 0.4% for the month, while its public sector counterpart shrank 2%. Four of the five largest nonresidential subsectors—power, highway and street, commercial and manufacturing—combined to fall 2.2% on a monthly basis.
“While previous weak spending reports can almost completely be explained by diminished public construction spending, today’s report also revealed emerging weakness in private spending,” says ABC Chief Economist Anirban Basu.
However, spending has increased in some areas. Office-related construction increased 2% for the month and 24 percent on a year-over-year basis. Meanwhile, lodging-related construction spending increased 1.2% for the month and almost 16% year-over-year.
Other areas have underperformed. “Given the passage of a federal highway bill last year, one might have expected spending growth in the highway/street and transportation categories,” Basu says. “Those expectations have been unmet thus far. Transportation-related construction spending dipped by more than 6 percent in August and by more than 11 percent on a year-over-year basis. Highway and street spending is down by more than 8 percent on a year-ago basis, and was down nearly 3 percent for the month.”
Related Stories

Market Data | Aug 2, 2021
Nonresidential construction spending falls again in June
The fall was driven by a big drop in funding for highway and street construction and other public work.

Market Data | Jul 29, 2021
Outlook for construction spending improves with the upturn in the economy
The strongest design sector performers for the remainder of this year are expected to be health care facilities.

Market Data | Jul 29, 2021
Construction employment lags or matches pre-pandemic level in 101 metro areas despite housing boom
Eighty metro areas had lower construction employment in June 2021 than February 2020.

Market Data | Jul 28, 2021
Marriott has the largest construction pipeline of U.S. franchise companies in Q2‘21
472 new hotels with 59,034 rooms opened across the United States during the first half of 2021.

Market Data | Jul 27, 2021
New York leads the U.S. hotel construction pipeline at the close of Q2‘21
Many hotel owners, developers, and management groups have used the operational downtime, caused by COVID-19’s impact on operating performance, as an opportunity to upgrade and renovate their hotels and/or redefine their hotels with a brand conversion.

Market Data | Jul 26, 2021
U.S. construction pipeline continues along the road to recovery
During the first and second quarters of 2021, the U.S. opened 472 new hotels with 59,034 rooms.

Market Data | Jul 21, 2021
Architecture Billings Index robust growth continues
AIA’s Architecture Billings Index (ABI) score for June remained at an elevated level of 57.1.

Market Data | Jul 20, 2021
Multifamily proposal activity maintains sizzling pace in Q2
Condos hit record high as all multifamily properties benefit from recovery.

Market Data | Jul 19, 2021
Construction employment trails pre-pandemic level in 39 states
Supply chain challenges, rising materials prices undermine demand.

Market Data | Jul 15, 2021
Producer prices for construction materials and services soar 26% over 12 months
Contractors cope with supply hitches, weak demand.


