


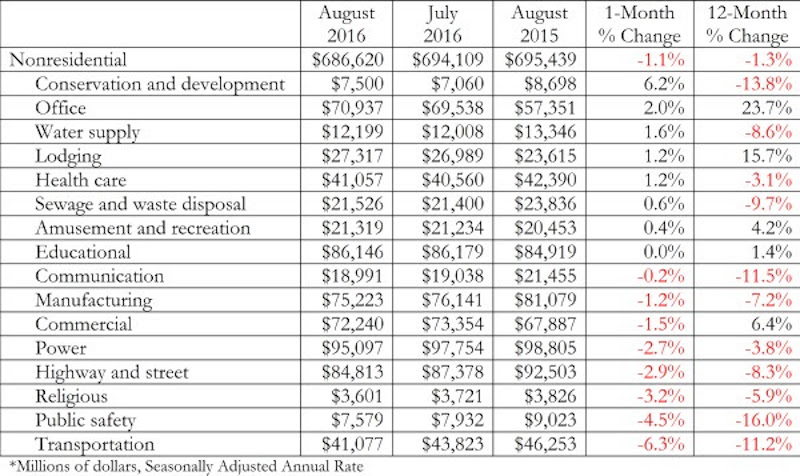
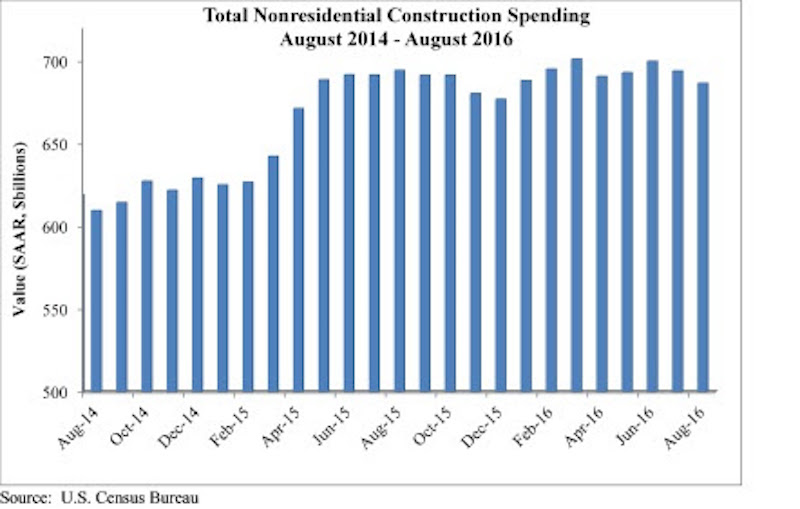
Nonresidential construction spending fell for a second consecutive month in August, according to analysis of U.S. Census Bureau released today by Associated Builders and Contractors (ABC). Nonresidential spending totaled $686.6 billion on a seasonally adjusted, annualized basis for the month, 1.1% lower than July’s total of $694.1 billion (revised down from $701 billion) and 1.3% below August 2015’s figure.
Private nonresidential construction spending fell just 0.4% for the month, while its public sector counterpart shrank 2%. Four of the five largest nonresidential subsectors—power, highway and street, commercial and manufacturing—combined to fall 2.2% on a monthly basis.
“While previous weak spending reports can almost completely be explained by diminished public construction spending, today’s report also revealed emerging weakness in private spending,” says ABC Chief Economist Anirban Basu.
However, spending has increased in some areas. Office-related construction increased 2% for the month and 24 percent on a year-over-year basis. Meanwhile, lodging-related construction spending increased 1.2% for the month and almost 16% year-over-year.
Other areas have underperformed. “Given the passage of a federal highway bill last year, one might have expected spending growth in the highway/street and transportation categories,” Basu says. “Those expectations have been unmet thus far. Transportation-related construction spending dipped by more than 6 percent in August and by more than 11 percent on a year-over-year basis. Highway and street spending is down by more than 8 percent on a year-ago basis, and was down nearly 3 percent for the month.”
Related Stories

Market Data | Jan 7, 2022
Construction adds 22,000 jobs in December
Jobless rate falls to 5% as ongoing nonresidential recovery offsets rare dip in residential total.

Market Data | Jan 6, 2022
Inflation tempers optimism about construction in North America
Rider Levett Bucknall’s latest report cites labor shortages and supply chain snags among causes for cost increases.

Market Data | Jan 6, 2022
A new survey offers a snapshot of New York’s construction market
Anchin’s poll of 20 AEC clients finds a “growing optimism,” but also multiple pressure points.

Market Data | Jan 3, 2022
Construction spending in November increases from October and year ago
Construction spending in November totaled $1.63 trillion at a seasonally adjusted annual rate.

Market Data | Dec 22, 2021
Two out of three metro areas add construction jobs from November 2020 to November 2021
Construction employment increased in 237 or 66% of 358 metro areas over the last 12 months.

Market Data | Dec 17, 2021
Construction jobs exceed pre-pandemic level in 18 states and D.C.
Firms struggle to find qualified workers to keep up with demand.

Market Data | Dec 15, 2021
Widespread steep increases in materials costs in November outrun prices for construction projects
Construction officials say efforts to address supply chain challenges have been insufficient.

Market Data | Dec 15, 2021
Demand for design services continues to grow
Changing conditions could be on the horizon.

Market Data | Dec 5, 2021
Construction adds 31,000 jobs in November
Gains were in all segments, but the industry will need even more workers as demand accelerates.

Market Data | Dec 5, 2021
Construction spending rebounds in October
Growth in most public and private nonresidential types is offsetting the decline in residential work.


