

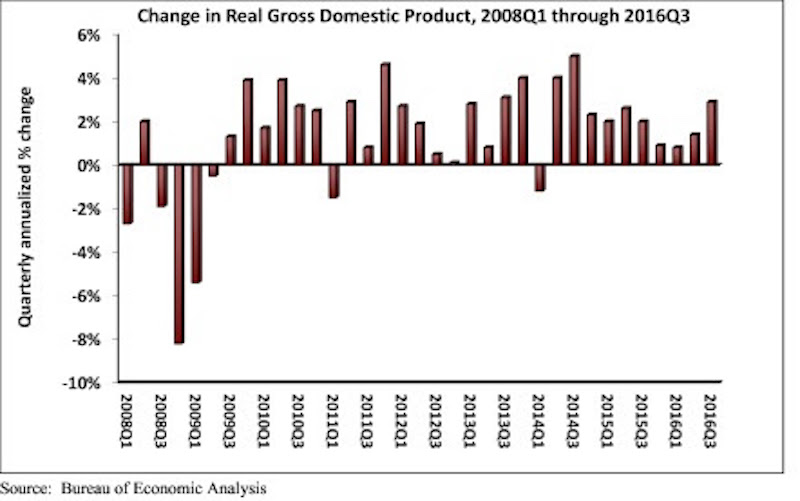
Real gross domestic product (GDP) expanded 2.9 percent on a seasonally adjusted annualized rate during the third quarter of 2016, according to an analysis of Bureau of Economic Analysis data released today by Associated Builders and Contractors (ABC). This follows a 1.4 percent increase during the second quarter and represents the tenth consecutive quarter of economic expansion.
Nonresidential fixed investment, a category closely aligned with construction and other forms of business investment, expanded at a 1.2 percent annualized rate during the third quarter after growing 1 percent during the second. Investment in structures led the way, increasing by 5.4 percent in the third quarter after falling 2.1 percent during the second. Investment in equipment fell 2.7 percent for the quarter, while investment in intellectual property products expanded 4 percent. Residential investment continued to fall, declining 6.2 percent in the third quarter after falling 7.7 percent during the second.
The following highlights emerged from today’s third quarter GDP release. All growth figures are presented as seasonally adjusted annualized rates:
- Personal consumption expenditures expanded 2.1 percent on an annualized basis during the third quarter of 2016 after growing 4.3 percent during the second quarter of 2016.
- Spending on goods rose 2.2 percent during the third quarter after expanding by 7.1 percent during the previous quarter.
- Real final sales of domestically produced output increased 2.3 percent in the third quarter after increasing 2.6 percent in the second.
- Federal government spending expanded 2.5 percent in the year’s third quarter after contracting during each of the prior two quarters.
- Nondefense government spending increased 3 percent during the quarter following an increase of 3.8 percent during the second.
- National defense spending grew by 2.1 percent during the third quarter after registering a 3.2 percent decline in the previous quarter.
- State and local government spending fell by 0.7 percent in the third quarter after falling 2.5 percent in the second quarter.
“The acceleration in real GDP growth was driven by a combination of factors, including an upturn in exports, a smaller decrease in state and local government spending and an upturn in federal government spending. One of the biggest impacts came from greater private inventory investment, likely in response to expectations for reasonably strong consumer spending. Growth in personal consumption expenditures was responsible for almost half of third quarter GDP growth. However, this build in inventories is likely to subtract from economic growth in future quarters, though not massively,” says ABC Chief Economist Anirban Basu.
“Third quarter growth was solid, but future quarters may not be as good,” Basu says. “The economy will have to deal with a number of headwinds going forward, including a stronger dollar, building inflationary pressures and higher interest rates. Consumer spending growth will continue to lead the recovery. While this will help support construction spending in certain categories, including distribution centers, nonresidential investment in structures is likely to expand only slowly in early 2017.”

Related Stories

Market Data | Feb 21, 2020
Construction contractor confidence remains steady
70% of contractors expect their sales to increase over the first half of 2020.

Market Data | Feb 20, 2020
U.S. multifamily market gains despite seasonal lull
The economy’s steady growth buoys prospects for continued strong performance.

Market Data | Feb 19, 2020
Architecture billings continue growth into 2020
Demand for design services increases across all building sectors.

Market Data | Feb 5, 2020
Construction employment increases in 211 out of 358 metro areas from December 2018 to 2019
Dallas-Plano-Irving, Texas and Kansas City have largest gains; New York City and Fairbanks, Alaska lag the most as labor shortages likely kept firms in many areas from adding even more workers.

Market Data | Feb 4, 2020
Construction spending dips in December as nonresidential losses offset housing pickup
Homebuilding strengthens but infrastructure and other nonresidential spending fades in recent months, reversing pattern in early 2019.

Market Data | Feb 4, 2020
IMEG Corp. acquires Clark Engineering
Founded in 1938 in Minneapolis, Clark Engineering has an extensive history of public and private project experience.

Market Data | Jan 30, 2020
U.S. economy expands 2.1% in 4th quarter
Investment in structures contracts.

Market Data | Jan 30, 2020
US construction & real estate industry sees a drop of 30.4% in deal activity in December 2019
A total of 48 deals worth $505.11m were announced in December 2019.

Market Data | Jan 29, 2020
Navigant research report finds global wind capacity value is expected to increase tenfold over the next decade
Wind power is being developed in more countries as well as offshore and onshore.

Market Data | Jan 28, 2020
What eight leading economists predict for nonresidential construction in 2020 and 2021
Public safety, education, and healthcare highlight a market that is entering growth-slowdown mode, but no downturn is projected, according to AIA's latest Consensus Construction Forecast panel.


