

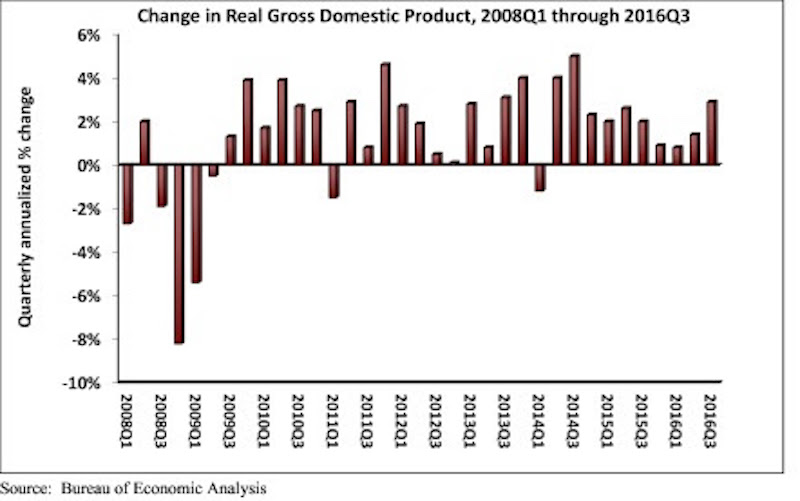
Real gross domestic product (GDP) expanded 2.9 percent on a seasonally adjusted annualized rate during the third quarter of 2016, according to an analysis of Bureau of Economic Analysis data released today by Associated Builders and Contractors (ABC). This follows a 1.4 percent increase during the second quarter and represents the tenth consecutive quarter of economic expansion.
Nonresidential fixed investment, a category closely aligned with construction and other forms of business investment, expanded at a 1.2 percent annualized rate during the third quarter after growing 1 percent during the second. Investment in structures led the way, increasing by 5.4 percent in the third quarter after falling 2.1 percent during the second. Investment in equipment fell 2.7 percent for the quarter, while investment in intellectual property products expanded 4 percent. Residential investment continued to fall, declining 6.2 percent in the third quarter after falling 7.7 percent during the second.
The following highlights emerged from today’s third quarter GDP release. All growth figures are presented as seasonally adjusted annualized rates:
- Personal consumption expenditures expanded 2.1 percent on an annualized basis during the third quarter of 2016 after growing 4.3 percent during the second quarter of 2016.
- Spending on goods rose 2.2 percent during the third quarter after expanding by 7.1 percent during the previous quarter.
- Real final sales of domestically produced output increased 2.3 percent in the third quarter after increasing 2.6 percent in the second.
- Federal government spending expanded 2.5 percent in the year’s third quarter after contracting during each of the prior two quarters.
- Nondefense government spending increased 3 percent during the quarter following an increase of 3.8 percent during the second.
- National defense spending grew by 2.1 percent during the third quarter after registering a 3.2 percent decline in the previous quarter.
- State and local government spending fell by 0.7 percent in the third quarter after falling 2.5 percent in the second quarter.
“The acceleration in real GDP growth was driven by a combination of factors, including an upturn in exports, a smaller decrease in state and local government spending and an upturn in federal government spending. One of the biggest impacts came from greater private inventory investment, likely in response to expectations for reasonably strong consumer spending. Growth in personal consumption expenditures was responsible for almost half of third quarter GDP growth. However, this build in inventories is likely to subtract from economic growth in future quarters, though not massively,” says ABC Chief Economist Anirban Basu.
“Third quarter growth was solid, but future quarters may not be as good,” Basu says. “The economy will have to deal with a number of headwinds going forward, including a stronger dollar, building inflationary pressures and higher interest rates. Consumer spending growth will continue to lead the recovery. While this will help support construction spending in certain categories, including distribution centers, nonresidential investment in structures is likely to expand only slowly in early 2017.”

Related Stories

Market Data | Jun 3, 2020
6 must reads for the AEC industry today: June 3, 2020
5 ways to improve cleanliness of public restrooms and office owners are in no hurry for tenants to return.

Market Data | Jun 2, 2020
Architects, health experts release strategies, tools for safely reopening buildings
AIA issues three new and enhanced tools for reducing risk of COVID-19 transmission in buildings.

Market Data | Jun 2, 2020
5 must reads for the AEC industry today: June 2, 2020
New Luxembourg office complex breaks ground and nonresidential construction spending falls.
Market Data | Jun 1, 2020
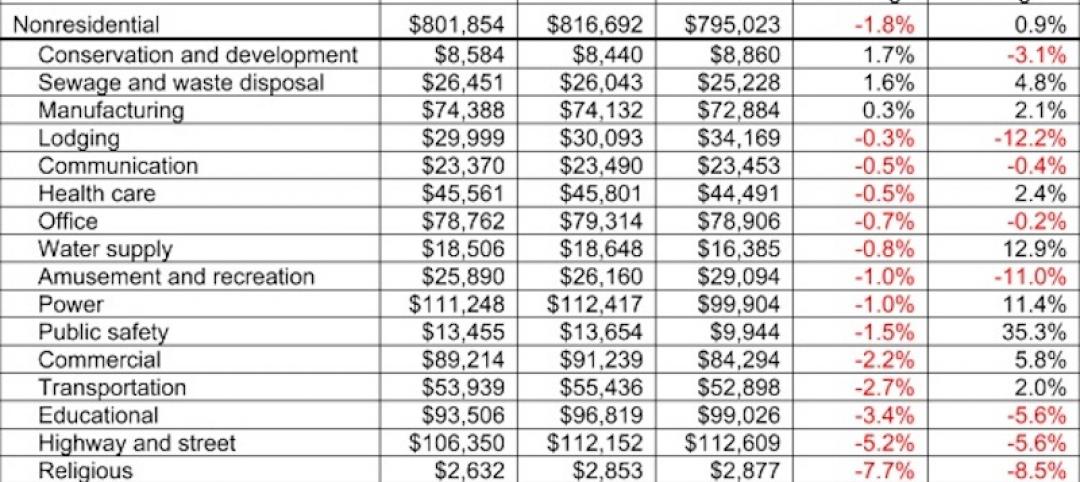
Nonresidential construction spending falls in April
Of the 16 subcategories, 13 were down on a monthly basis.
Market Data | Jun 1, 2020
7 must reads for the AEC industry today: June 1, 2020
Energy storage as an amenity and an entry-point for wellness screening everywhere.

Market Data | May 29, 2020
House-passed bill making needed improvements to paycheck protection program will allow construction firms to save more jobs
Construction official urges senate and White House to quickly pass and sign into law the Paycheck Protection Program Flexibility Act.

Market Data | May 29, 2020
7 must reads for the AEC industry today: May 29, 2020
Using lighting IoT data to inform a safer office reentry strategy and Ghafari joins forces with Eview 360.

Market Data | May 27, 2020
5 must reads for the AEC industry today: May 28, 2020
Biophilic design on the High Line and the office market could be a COVID-19 casualty.

Market Data | May 27, 2020
6 must reads for the AEC industry today: May 27, 2020
AIA's COTE Top Ten Awards and OSHA now requires employers to track COVID-19 cases.

Market Data | May 26, 2020
6 must reads for the AEC industry today: May 26, 2020
Apple's new Austin hotel and is CLT really a green solution?


