


According to an Associated Builders and Contractors analysis of U.S. Census Bureau data published today, national nonresidential construction spending declined 0.3% in July totaling $776 billion on a seasonally adjusted annualized basis, and increased 0.1% compared to July 2018. The June 2019 estimates were revised upward from $773.8 billion to $778.5 billion.
In July, private nonresidential spending decreased 0.8% on a monthly basis and 2.7% on a yearly basis. Public nonresidential spending, however, increased 0.4% for the month and 4.3% for the year.
"While there is much discussion regarding the extent to which the U.S. economy has slowed and will slow going forward, these considerations have relatively little to do with today's nonresidential construction spending data," said ABC Chief Economist Anirban Basu. "Trends in nonresidential construction tend to lag the broader economy by a year to 18 months, which means that today's construction spending numbers reflect in large measure broader economic dynamics characterizing 2018. Last year was a good one for the economy, persuading many to move ahead with projects.
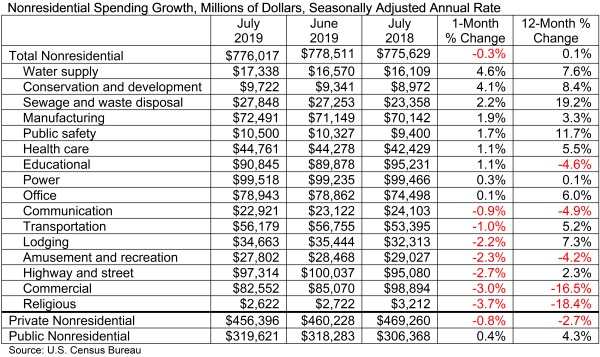
"Recent construction spending data, therefore, have been impacted by factors more closely related to the industry," said Basu. "For instance, the recent weakening in certain private construction segments, including office and lodging, are likely due to growing concerns regarding overbuilding and the somewhat higher cost of capital. Public spending growth, despite solid numbers in July, has been more erratic of late. This may have something to do with the looming insolvency of the Highway Trust Fund, which is expected in 2021 without congressional action. There is already evidence that some states have begun to postpone planning for new projects until there is more clarity regarding federal infrastructure spending, evident in the 2.7% spending decline observed in the highway and street category.
"Despite recent slow growth in construction spending, the U.S. construction industry has continued to expand employment levels during the past year," said Basu. "ABC’s Construction Backlog Indicator continues to show that the average contractor or subcontractor will remain busy over the near term. One of the reasons for relatively slow growth in nonresidential construction spending may simply be that the U.S. contracting community cannot deliver significantly more service in the context of worsening labor/skills shortages. In other words, nonresidential construction volume may already be near its peak potential supply. Given that, one wouldn't expect substantial growth in construction spending even in the context of significantly stronger economic growth."
Related Stories
Market Data | Jul 29, 2020
62% of metros shed construction jobs from June 2019 to June 2020 as Association calls for new infrastructure funding, other relief steps
New York City and Brockton-Bridgewater-Easton, Mass. have worst 12-month losses, while Austin and Walla Walla, Wash. top job gainers.

Market Data | Jul 29, 2020
6 must reads for the AEC industry today: July 29, 2020
The world's first net-zero airport and California utility adopts climate emergency declaration.

Market Data | Jul 28, 2020
For the fourth consecutive quarter, Los Angeles leads the U.S. hotel construction pipeline at the close of Q2’ 20
New York City continues to have the greatest number of projects under construction, with 106 projects/18,354 rooms.

Market Data | Jul 28, 2020
6 must reads for the AEC industry today: July 28, 2020
St. Petersburg Pier reconstruction completes and post-pandemic workplace design will not be the same for all.
Market Data | Jul 28, 2020
Senate Republicans' coronavirus relief measure includes provisions that will help hard-hit construction firms recover
The HEALS Act includes essential liability, workforce, financial & unemployment reforms, but association will work to get needed infrastructure investments included in final relief measure.

Market Data | Jul 27, 2020
6 must reads for the AEC industry today: July 27, 2020
Customized labs give universities a recruiting edge and the U.S. construction pipeline remains robust through the first half of 2020.

Market Data | Jul 27, 2020
The U.S. construction pipeline remains robust through the first half of 2020, despite pandemic
Projects currently under construction stand at 1,771 projects/235,467 rooms, up 3% and 1% respectively, YOY.
Market Data | Jul 24, 2020
5 must reads for the AEC industry today: July 24, 2020
North Carolina will stop relying on FEMA flood mapping and Cal Poly Pomona's newest project.

Market Data | Jul 23, 2020
New LEED guidance from USGBC helps cities and communities expand resilience efforts in response to the COVID-19 pandemic
Credits integrate public health and social equity with sustainability planning.

Market Data | Jul 23, 2020
6 must reads for the AEC industry today: July 23, 2020
Skanska selects Pickard Chilton to design new ofice tower and days grow long at nursing homes as virus lockdowns drag on.


