


According to an Associated Builders and Contractors analysis of U.S. Census Bureau data published today, national nonresidential construction spending declined 0.3% in July totaling $776 billion on a seasonally adjusted annualized basis, and increased 0.1% compared to July 2018. The June 2019 estimates were revised upward from $773.8 billion to $778.5 billion.
In July, private nonresidential spending decreased 0.8% on a monthly basis and 2.7% on a yearly basis. Public nonresidential spending, however, increased 0.4% for the month and 4.3% for the year.
"While there is much discussion regarding the extent to which the U.S. economy has slowed and will slow going forward, these considerations have relatively little to do with today's nonresidential construction spending data," said ABC Chief Economist Anirban Basu. "Trends in nonresidential construction tend to lag the broader economy by a year to 18 months, which means that today's construction spending numbers reflect in large measure broader economic dynamics characterizing 2018. Last year was a good one for the economy, persuading many to move ahead with projects.
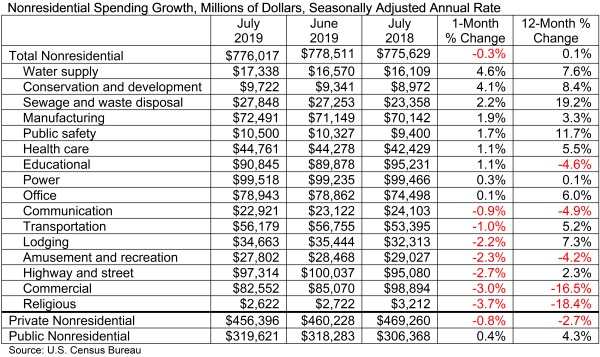
"Recent construction spending data, therefore, have been impacted by factors more closely related to the industry," said Basu. "For instance, the recent weakening in certain private construction segments, including office and lodging, are likely due to growing concerns regarding overbuilding and the somewhat higher cost of capital. Public spending growth, despite solid numbers in July, has been more erratic of late. This may have something to do with the looming insolvency of the Highway Trust Fund, which is expected in 2021 without congressional action. There is already evidence that some states have begun to postpone planning for new projects until there is more clarity regarding federal infrastructure spending, evident in the 2.7% spending decline observed in the highway and street category.
"Despite recent slow growth in construction spending, the U.S. construction industry has continued to expand employment levels during the past year," said Basu. "ABC’s Construction Backlog Indicator continues to show that the average contractor or subcontractor will remain busy over the near term. One of the reasons for relatively slow growth in nonresidential construction spending may simply be that the U.S. contracting community cannot deliver significantly more service in the context of worsening labor/skills shortages. In other words, nonresidential construction volume may already be near its peak potential supply. Given that, one wouldn't expect substantial growth in construction spending even in the context of significantly stronger economic growth."
Related Stories

Market Data | Aug 10, 2020
5 must reads for the AEC industry today: August 10, 2020
Private student housing owners reap the benefits as campus housing de-densifies and race for COVID vaccine boosts real estate in life sciences hubs.

Market Data | Aug 7, 2020
6 must reads for the AEC industry today: August 7, 2020
BD+C's 2020 Color Trends Report and HMC releases COVID-19 Campus Reboot Guide for Prek-12 schools.

Market Data | Aug 6, 2020
6 must reads for the AEC industry today: August 6, 2020
Oklahoma State's new North Academic Building and can smart buildings outsmart coronavirus?

Market Data | Aug 5, 2020
6 must reads for the AEC industry today: August 5, 2020
San Jose's new tallest tower and Virginia is the first state to adopt COVID-19 worker safety rules.

Market Data | Aug 4, 2020
7 must reads for the AEC industry today: August 4, 2020
Construction spending decreases for fourth consecutive month and 100% affordable housing development breaks ground in Mountain View.
Market Data | Aug 3, 2020
Construction spending decreases for fourth consecutive month in June
Association officials warn further contraction is likely unless federal government enacts prompt, major investment in infrastructure as state and local governments face deficits.

Market Data | Aug 3, 2020
6 must reads for the AEC industry today: August 3, 2020
The future is a number game for retail and restaurants and 5 reasons universities are renovating student housing.

Market Data | Jul 31, 2020
5 must reads for the AEC industry today: July 31, 2020
Vegas's newest resort and casino is packed with contactless technology and Mariott, Hilton, and IHG dominate the U.S. hotel construction pipeline.

Market Data | Jul 30, 2020
Marriott, Hilton, and IHG continue to dominate the U.S. hotel construction pipeline at Q2’20 close
Hilton’s Home2 Suites and IHG’s Holiday Inn Express continue to be the most prominent brands in the U.S. pipeline.

Market Data | Jul 30, 2020
7 must reads for the AEC industry today: July 30, 2020
Millennium Tower finally has a fix and construction costs decrease for the first time in 10 years.


