


National nonresidential construction spending decreased 0.4% in January, according to an Associated Builders and Contractors analysis of data published today by the U.S. Census Bureau. On a seasonally adjusted annualized basis, nonresidential spending totaled $1.190 trillion.
Spending was down on a monthly basis in 10 of the 16 nonresidential subcategories. Private nonresidential spending fell 0.1%, while public nonresidential construction spending was down 1.0% in January.
“Nonresidential construction spending fell sharply in January, ending a 19-month streak of monthly gains,” said ABC Chief Economist Anirban Basu. “Some of this decrease is due to weather-related factors. That’s especially true in infrastructure categories like highway and street and water supply, both of which exhibited steep declines in spending to start the year but should remain elevated through 2024.
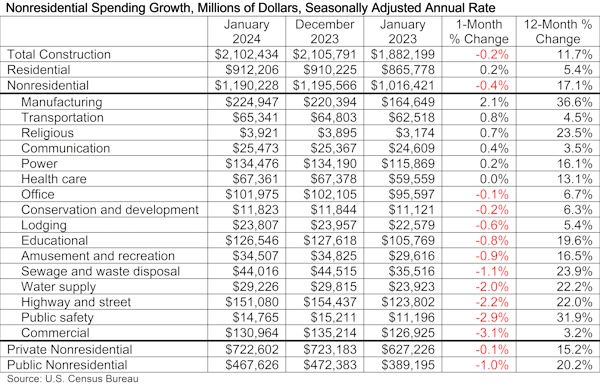
“Construction spending in the manufacturing category, on the other hand, continued to surge in January,” said Basu. “Manufacturing now accounts for nearly $1 of every $5 of nonresidential construction spending.
“Despite January’s disappointing data, nonresidential construction spending is still up more than 17% over the past year,” said Basu. “Given that year-over-year strength and the fact that a majority of contractors expect their sales to increase over the next six months, according to ABC’s Construction Confidence Index, spending is likely to rebound over the coming months.”
Related Stories

Market Data | Feb 14, 2019
U.S. Green Building Council announces top 10 countries and regions for LEED green building
The list ranks countries and regions in terms of cumulative LEED-certified gross square meters as of December 31, 2018.

Market Data | Feb 13, 2019
Increasingly tech-enabled construction industry powers forward despite volatility
Construction industry momentum to carry through first half of 2019.

Market Data | Feb 4, 2019
U.S. Green Building Council announces annual Top 10 States for LEED Green Building in 2018
Illinois takes the top spot as USGBC defines the next generation of green building with LEED v4.1.

Market Data | Feb 4, 2019
Nonresidential construction spending dips in November
Total nonresidential spending stood at $751.5 billion on a seasonally adjusted annualized rate.

Market Data | Feb 1, 2019
The year-end U.S. hotel construction pipeline continues steady growth trend
Project counts in the early planning stage continue to rise reaching an all-time high of 1,723 projects/199,326 rooms.

Market Data | Feb 1, 2019
Construction spending is projected to increase by more than 11% through 2022
FMI’s annual outlook also expects the industry’s frantic M&A activity to be leavened by caution going forward.

Market Data | Jan 23, 2019
Architecture billings slow, but close 2018 with growing demand
AIA’s Architecture Billings Index (ABI) score for December was 50.4 compared to 54.7 in November.

Market Data | Jan 16, 2019
AIA 2019 Consensus Forecast: Nonresidential construction spending to rise 4.4%
The education, public safety, and office sectors will lead the growth areas this year, but AIA's Kermit Baker offers a cautious outlook for 2020.

Market Data | Dec 19, 2018
Brokers look forward to a commercial real estate market that mirrors 2018’s solid results
Respondents to a recent Transwestern poll expect flat to modest growth for rents and investment in offices, MOBs, and industrial buildings.

Market Data | Dec 19, 2018
When it comes to economic clout, New York will far outpace other U.S. metros for decades to come
But San Jose, Calif., is expected to have the best annual growth rate through 2035, according to Oxford Economics’ latest Global Cities report.


