


National nonresidential construction spending decreased 0.4% in January, according to an Associated Builders and Contractors analysis of data published today by the U.S. Census Bureau. On a seasonally adjusted annualized basis, nonresidential spending totaled $1.190 trillion.
Spending was down on a monthly basis in 10 of the 16 nonresidential subcategories. Private nonresidential spending fell 0.1%, while public nonresidential construction spending was down 1.0% in January.
“Nonresidential construction spending fell sharply in January, ending a 19-month streak of monthly gains,” said ABC Chief Economist Anirban Basu. “Some of this decrease is due to weather-related factors. That’s especially true in infrastructure categories like highway and street and water supply, both of which exhibited steep declines in spending to start the year but should remain elevated through 2024.
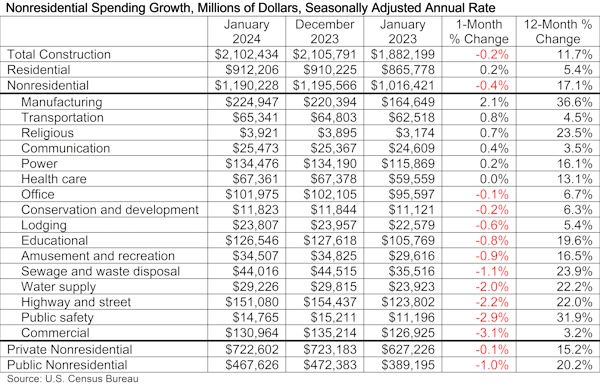
“Construction spending in the manufacturing category, on the other hand, continued to surge in January,” said Basu. “Manufacturing now accounts for nearly $1 of every $5 of nonresidential construction spending.
“Despite January’s disappointing data, nonresidential construction spending is still up more than 17% over the past year,” said Basu. “Given that year-over-year strength and the fact that a majority of contractors expect their sales to increase over the next six months, according to ABC’s Construction Confidence Index, spending is likely to rebound over the coming months.”
Related Stories

Market Data | Jul 16, 2019
ABC’s Construction Backlog Indicator increases modestly in May
The Construction Backlog Indicator expanded to 8.9 months in May 2019.

K-12 Schools | Jul 15, 2019
Summer assignments: 2019 K-12 school construction costs
Using RSMeans data from Gordian, here are the most recent costs per square foot for K-12 school buildings in 10 cities across the U.S.

Market Data | Jul 12, 2019
Construction input prices plummet in June
This is the first time in nearly three years that input prices have fallen on a year-over-year basis.

Market Data | Jul 1, 2019
Nonresidential construction spending slips modestly in May
Among the 16 nonresidential construction spending categories tracked by the Census Bureau, five experienced increases in monthly spending.

Market Data | Jul 1, 2019
Almost 60% of the U.S. construction project pipeline value is concentrated in 10 major states
With a total of 1,302 projects worth $524.6 billion, California has both the largest number and value of projects in the U.S. construction project pipeline.

Market Data | Jun 21, 2019
Architecture billings remain flat
AIA’s Architecture Billings Index (ABI) score for May showed a small increase in design services at 50.2.

Market Data | Jun 19, 2019
Number of U.S. architects continues to rise
New data from NCARB reveals that the number of architects continues to increase.

Market Data | Jun 12, 2019
Construction input prices see slight increase in May
Among the 11 subcategories, six saw prices fall last month, with the largest decreases in natural gas.

Market Data | Jun 3, 2019
Nonresidential construction spending up 6.4% year over year in April
Among the 16 sectors tracked by the U.S. Census Bureau, nine experienced an increase in monthly spending, led by water supply and highway and street.

Market Data | Jun 3, 2019
4.1% annual growth in office asking rents above five-year compound annual growth rate
Market has experienced no change in office vacancy rates in three quarters.


