


Nonresidential construction spending bounced back in October, expanding 1 percent on a monthly basis and 4.3 percent year over year, according to a Dec. 2 release from the U.S. Census Bureau. Spending for the month totaled $611.8 billion on a seasonally adjusted, annualized basis. Additionally, the government revised the September spending figure up to $605.8 billion from $596.1 billion.
"This month's increase in nonresidential construction spending is far more consistent with the anecdotal information floating around the industry, which generally indicates that firms are becoming busier and that backlog is expanding," said Associated Builders and Contractors (ABC) Chief Economist Anirban Basu. "Although last month's numbers for nonresidential construction spending and employment were disappointing and could have implied the nation's nonresidential construction recovery is stalling, that is not the case.
"The outlook for 2015 remains upbeat," said Basu. "The economy has gained momentum over the past six to seven months and that is consistent with more aggressive construction starts and spending during the year to come. Even as the economy has gained momentum, the Federal Reserve has remained extraordinarily accommodative due in part to benign inflation readings. Low interest rates combined with solid economic momentum likely mean expansion for the nonresidential construction industry during the year ahead."
Eleven of the 16 nonresidential construction subsectors posted monthly increases in spending. Here's a recap:
• Office-related construction spending grew by 2 percent in October and is up 16.3 percent from the same time one year ago.
• Lodging construction spending is up 3.3 percent on a monthly basis and is up 15.9 percent on a year-over-year basis.
• Conservation and development-related construction spending grew 4.6 percent for the month and is up 33.1 percent on a yearly basis.
• Spending in the water supply category expanded 0.9 percent on a monthly basis, but is down 1.8 percent on a year-over-year basis.
• Amusement and recreation-related construction spending expanded 2.2 percent in October and is up 1.4 percent from the same time last year.
• Manufacturing-related spending expanded 3.4 percent on a monthly basis and is up 22.2 percent on an annual basis.
• Healthcare-related construction spending expanded 0.6 percent for the month but is down 8.4 percent from the same time last year.
• Education-related construction spending expanded 1.8 percent for the month and is up 3.6 percent on a year-over-year basis.
• Construction spending in the transportation category expanded 2.7 percent on a monthly basis and has expanded 1.6 percent on an annual basis.
• Highway and street-related construction spending expanded 1.2 percent in October and is up 0.1 percent compared to the same time last year.
• Public safety-related construction spending expanded 11.6 percent on a monthly basis but is down 1.2 percent on a year-over-year basis.
Monthly spending in five nonresidential construction subsectors declined in October. They are:
• Commercial construction spending fell 2.2 percent for the month but has grown 9.1 percent on a year-over-year basis.
• Communication construction spending declined 1.9 percent for the month and is down 9.4 percent for the year.
• Religious construction spending fell 3.7 percent for the month and is down 4.6 percent from the same time last year.
• Sewage and waste disposal-related construction spending declined 0.4 percent for the month and is down 0.2 percent on a 12-month basis.
• Power construction spending fell 1 percent for the month but is 0.7 percent higher than at the same time one year ago.
To view the previous spending report, click here.
Related Stories

Resiliency | Feb 15, 2022
Design strategies for resilient buildings
LEO A DALY's National Director of Engineering Kim Cowman takes a building-level look at resilient design.

Products and Materials | Feb 14, 2022
How building owners and developers can get ahead of the next supply chain disaster
Global supply chain interruptions that started at the very beginning of the pandemic are still with us and compounding every step of the way. Below are a few proven tips on how to avert some of the costly fallout should we be faced with similar commercial disasters at any time in the future.

Urban Planning | Feb 14, 2022
5 steps to remake suburbs into green communities where people want to live, work, and play
Stantec's John Bachmann offers proven tactic for retrofitting communities for success in the post-COVID era.

Urban Planning | Feb 11, 2022
6 ways to breathe life into mixed-use spaces
To activate mixed-use spaces and realize their fullest potential, project teams should aim to create a sense of community and pay homage to the local history.
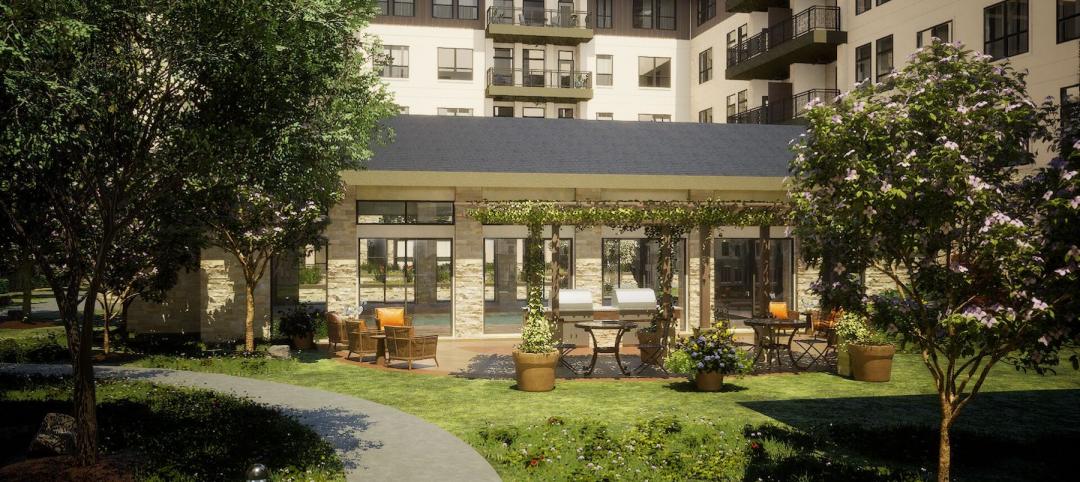
Senior Living Design | Feb 11, 2022
Design for senior living: A chat with Rocky Berg, AIA
Rob Cassidy, Editor of MULTIFAMILY Design + Construction, chats with Rocky Berg, AIA, Principal with Dallas architecture firm three, about how to design senior living communities to meet the needs of the owner, seniors, their families, and staff.
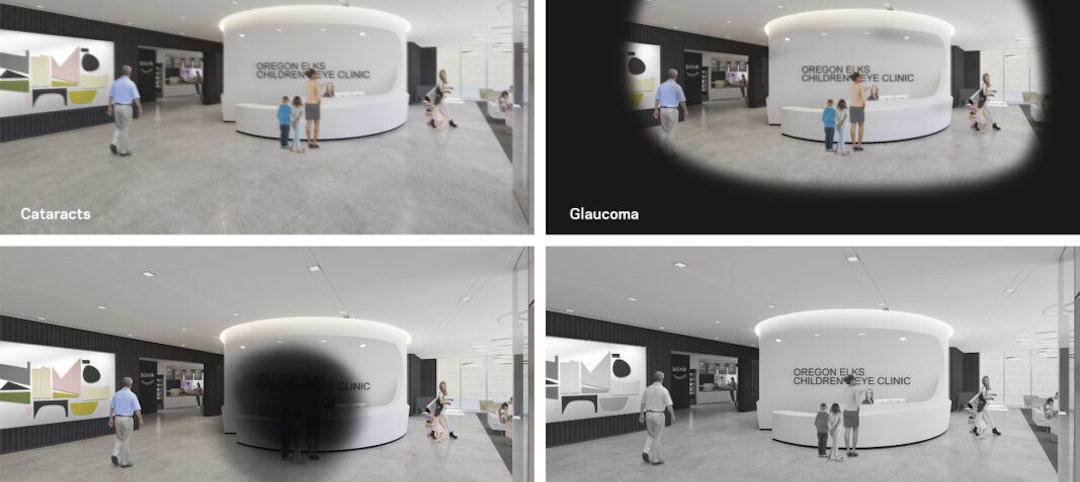
Architects | Feb 11, 2022
How computer simulations of vision loss create more empathetic buildings for the visually impaired
Here is a look at four challenges identified from our research and how the design responds accordingly.
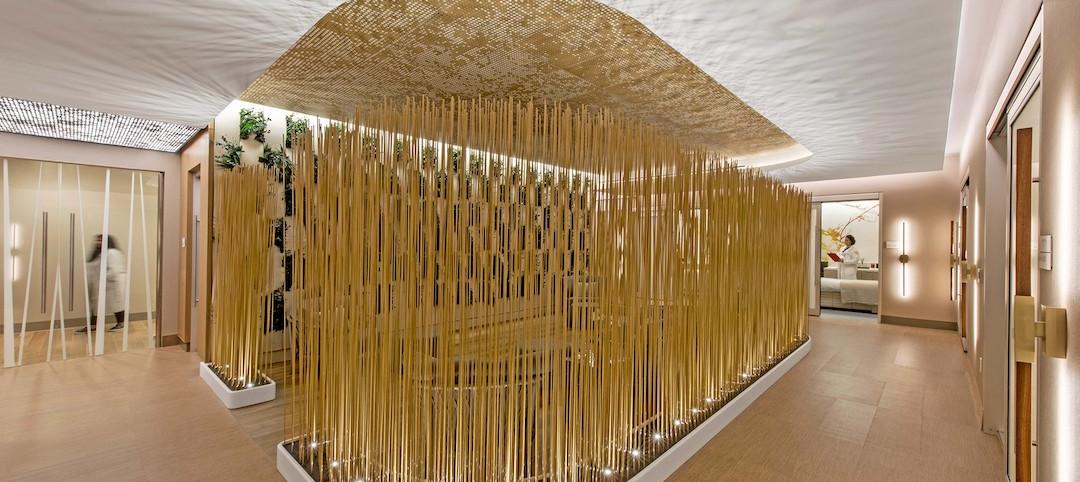
Healthcare Facilities | Feb 10, 2022
Respite for the weary healthcare worker
The pandemic has shined a light on the severe occupational stress facing healthcare workers. Creating restorative hospital environments can ease their feelings of anxiety and burnout while improving their ability to care for patients.

Architects | Feb 8, 2022
Perkins Eastman and BLT Architects merge
Expanding services in hospitality, education, and mixed-use sectors to better serve clients.

Architects | Feb 3, 2022
SmithGroup elevates Mark Adams to lead workplace practice
In his new role, Adams leads the firm’s practice devoted to the design of corporate and commercial facilities.

Architects | Feb 2, 2022
Steven L. Pliam joins LEO A DALY as Design Technology Leader
Pliam will oversee the deployment and use of technologies such as computational design, parametric design, digital practice, reality capture, visualization, virtual/augmented reality, GIS and AI/Machine Learning.


