


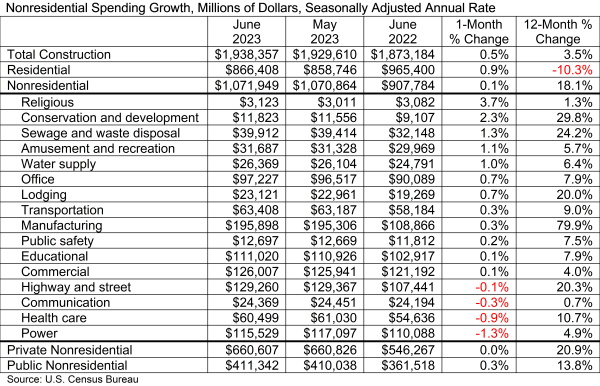
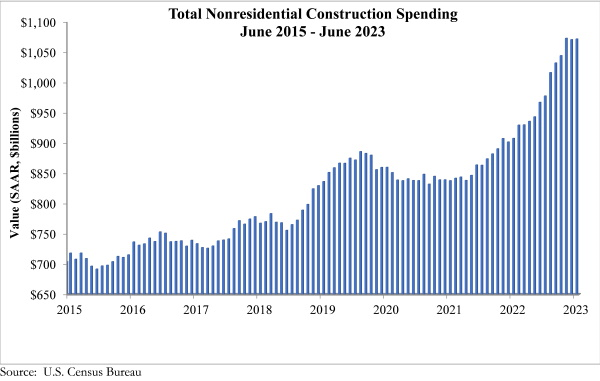
National nonresidential construction spending increased 0.1% in June, according to an Associated Builders and Contractors analysis of data published today by the U.S. Census Bureau. Spending is up 18% over the past 12 months. On a seasonally adjusted annualized basis, nonresidential spending totaled $1.07 trillion in June.
Spending increased on a monthly basis in 12 of the 16 nonresidential subcategories. Private nonresidential spending was virtually unchanged, while public nonresidential construction spending rose 0.3% in June.
“Nonresidential construction spending growth downshifted over the past two months,” said ABC Chief Economist Anirban Basu. “While stakeholders can expect ongoing spending growth in public nonresidential construction segments as more Infrastructure Investment and Jobs Act monies flow into the economy, private developer-driven activity appears to be drying up in the context of higher costs of capital and tighter credit conditions.
“Among other things, these dynamics will translate into larger spreads in performance among contractors,” said Basu. “While those that focus on public work stand to remain busy for years to come, those who specialize in meeting the needs of developers of office buildings, hotels and shopping centers are likely to struggle to support backlog going forward. The good news is that there remain private construction segments associated with rosier prospects, including manufacturing, data centers and healthcare.”
Related Stories

Market Data | Nov 10, 2021
Construction input prices see largest monthly increase since June
Construction input prices are 21.1% higher than in October 2020.

Market Data | Nov 9, 2021
Continued increases in construction materials prices starting to drive up price of construction projects
Supply chain and labor woes continue.

Market Data | Nov 5, 2021
Construction firms add 44,000 jobs in October
Gain occurs even as firms struggle with supply chain challenges.

Market Data | Nov 3, 2021
One-fifth of metro areas lost construction jobs between September 2020 and 2021
Beaumont-Port Arthur, Texas and Sacramento--Roseville--Arden-Arcade Calif. top lists of gainers.

Market Data | Nov 2, 2021
Construction spending slumps in September
A drop in residential work projects adds to ongoing downturn in private and public nonresidential.

Hotel Facilities | Oct 28, 2021
Marriott leads with the largest U.S. hotel construction pipeline at Q3 2021 close
In the third quarter alone, Marriott opened 60 new hotels/7,882 rooms accounting for 30% of all new hotel rooms that opened in the U.S.

Hotel Facilities | Oct 28, 2021
At the end of Q3 2021, Dallas tops the U.S. hotel construction pipeline
The top 25 U.S. markets account for 33% of all pipeline projects and 37% of all rooms in the U.S. hotel construction pipeline.

Market Data | Oct 27, 2021
Only 14 states and D.C. added construction jobs since the pandemic began
Supply problems, lack of infrastructure bill undermine recovery.

Market Data | Oct 26, 2021
U.S. construction pipeline experiences highs and lows in the third quarter
Renovation and conversion pipeline activity remains steady at the end of Q3 ‘21, with conversion projects hitting a cyclical peak, and ending the quarter at 752 projects/79,024 rooms.

Market Data | Oct 19, 2021
Demand for design services continues to increase
The Architecture Billings Index (ABI) score for September was 56.6.


